Current Day Gap Threshold HL Bias
Description
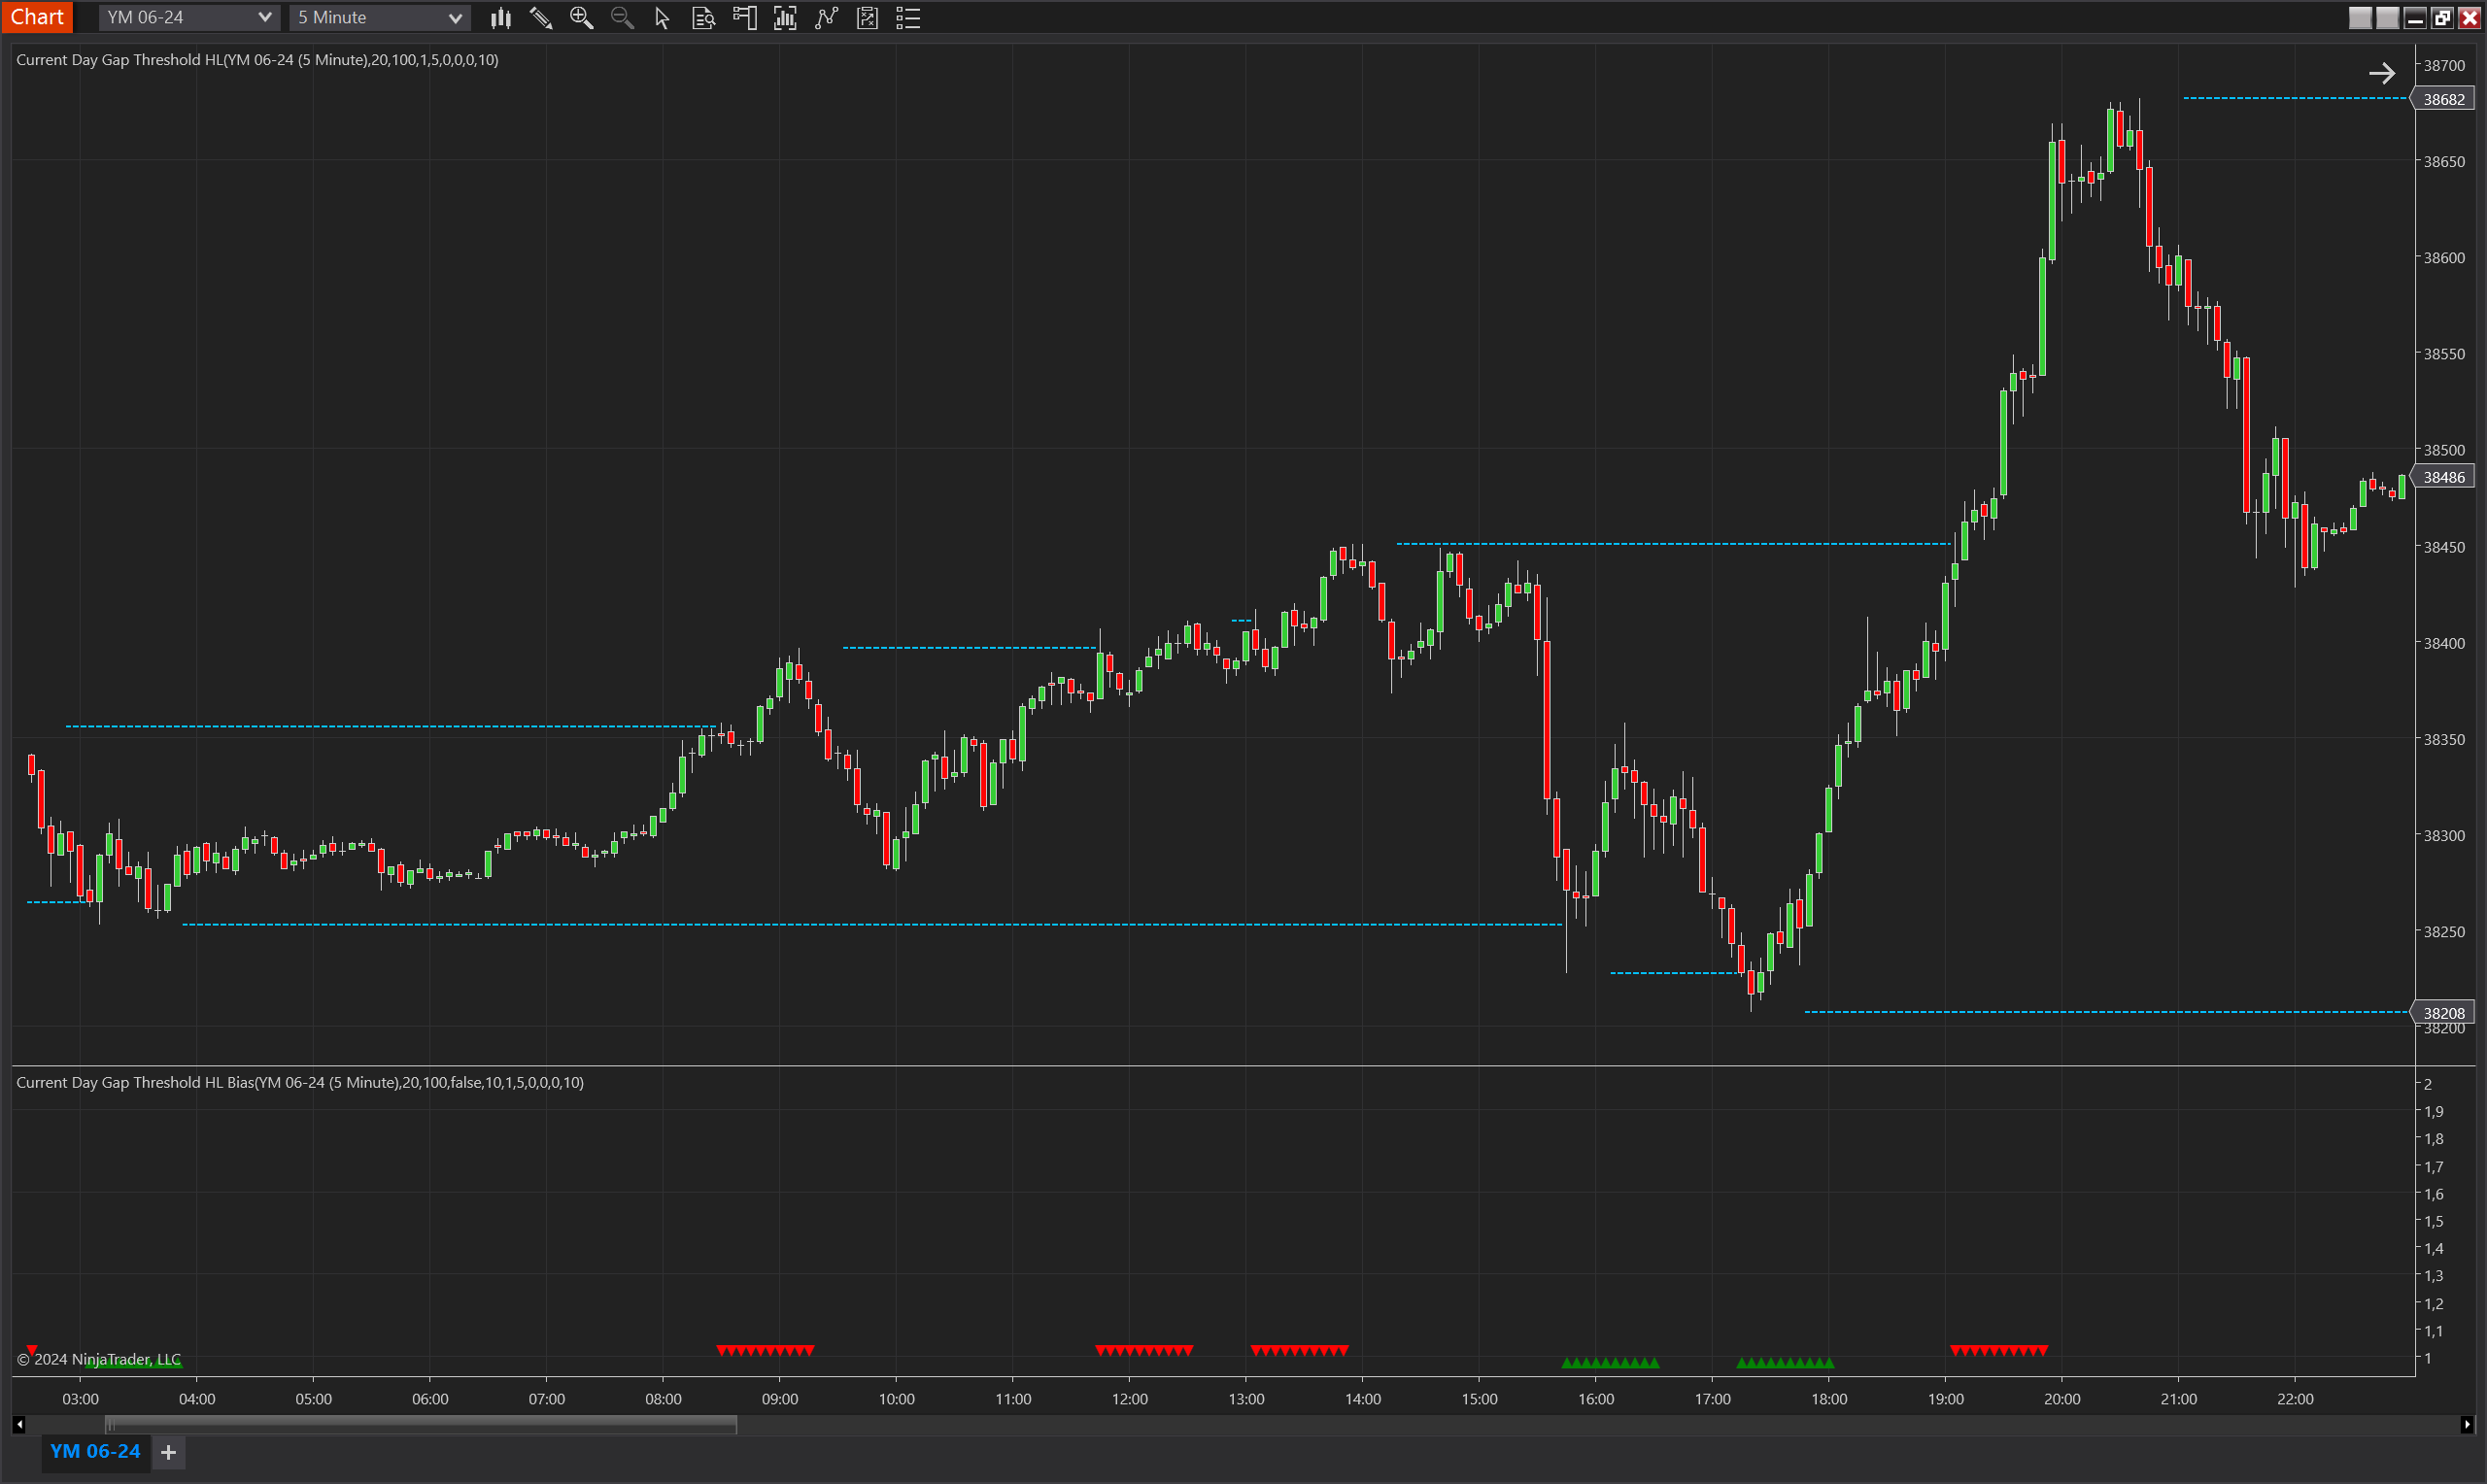
The Current Day Gap Threshold HL Bias indicator is a sophisticated tool designed for NinjaTrader 8, which assesses the bias in market movements based on daily high and low thresholds. It incorporates a primary indicator, the Current Day Gap Threshold HL, to determine significant price levels. The bias is established when the price action crosses these levels with a certain threshold gap, highlighting potential support and resistance zones.
The indicator not only considers the gap from the day's high or low but also includes additional parameters like the number of bars since the high or low, minimum Fair Value Gaps (FVGs) since the high or low, and a percentage of the Average True Range (ATR) as multipliers to gauge the strength of the breakout. These layers of criteria ensure that the bias signal is not triggered by minor fluctuations, but rather by substantial and meaningful market movements.
Key Features
- Daily High and Low Levels: Utilizes the current day's high and low as benchmarks to detect significant market breakouts.
- Gap Thresholds: Incorporates specific gap thresholds to avoid false signals and confirm genuine market moves.
- Fair Value Gaps (FVGs): Counts the number of FVGs since the last high or low to add confluence to the bias indication.
- ATR-Based Filtering: Leverages the Average True Range to filter out minor movements, focusing on substantial price changes.
- Customizable Parameters: Offers traders the flexibility to set the sensitivity of the bias indicator to match their trading style and risk profile.
Tips for Implementation
- Market Context: Use in conjunction with broader market analysis to understand the significance of the bias within the current market context.
- Combination with Momentum Indicators: Pair with momentum indicators like the Stochastic Oscillator or MACD to confirm the direction and strength of the market bias.
- Adjustable Parameters: Fine-tune the MinBarsSinceHL, MinFVGsSinceHL, and ATR multiple to align with different market conditions and volatility levels.
- Backtesting: Prior to implementation, backtest the indicator with historical data to ensure it resonates with your market outlook and trading strategy.
Parameters
Min Bars Since HL
- Type: int
- Description: Sets the minimum number of bars that must pass since the last recorded high or low to consider a new threshold level.
- Default Value: 5
- Valid Values: Any positive integer
Min FVGs Since HL
- Type: int
- Description: Determines the minimum number of Fair Value Gaps (FVGs) required since the last high or low to validate a threshold breach.
- Default Value: 0
- Valid Values: Any non-negative integer
Min Ticks
- Type: int
- Description: Specifies the minimum number of ticks that the price must move beyond the high or low to trigger a bias signal.
- Default Value: 10
- Valid Values: Any non-negative integer
Min ATR Multiple
- Type: int
- Description: The multiplier for the Average True Range (ATR) to define the significance of the price movement for a valid threshold.
- Default Value: 1
- Valid Values: Any non-negative integer
Min Range Percent
- Type: int
- Description: The percentage of the Donchian Channel range used to determine the activation of a high or low threshold level.
- Default Value: 0
- Valid Values: Any non-negative integer
Min Current Day Range Percent
- Type: int
- Description: Establishes the minimum percentage of the current day's price range that must be surpassed to consider a valid threshold breach.
- Default Value: 0
- Valid Values: Any non-negative integer
ATR Period
- Type: int
- Description: The lookback period for calculating the Average True Range (ATR), used in conjunction with Min ATR Multiple.
- Default Value: 20
- Valid Values: Any positive integer
DC Period
- Type: int
- Description: Defines the period for the Donchian Channel, which helps in determining the range within which the thresholds are calculated.
- Default Value: 100
- Valid Values: Any positive integer
Max Bias Validity
- Type: int
- Description: The duration in bars for which a bias is considered valid after it has been identified.
- Default Value: 5
- Valid Values: Any positive integer
Invert Bias Direction
- Type: bool
- Description: Allows the bias direction to be inverted; what is normally considered a bullish bias would be indicated as bearish, and vice versa.
- Default Value: false
Plots
BiasUp
- Type: Plot
- Style: Triangle Up
- Color: Green
- Description: This plot represents the occurrence of a bullish bias. It is visualized as green triangles pointing upwards, each marking the confirmation of bullish conditions based on the indicator’s specific criteria. The presence of these triangles on the chart indicates that the bullish bias is active during the defined validity period.
BiasDown
- Type: Plot
- Style: Triangle Down
- Color: Red
- Description: This plot indicates a bearish bias, depicted as red triangles pointing downwards. Each triangle marks the realization of bearish conditions as determined by the indicator's criteria. The appearance of these triangles signifies that the bearish bias is maintained throughout the specified validity period.