DC Extension Bias
Description
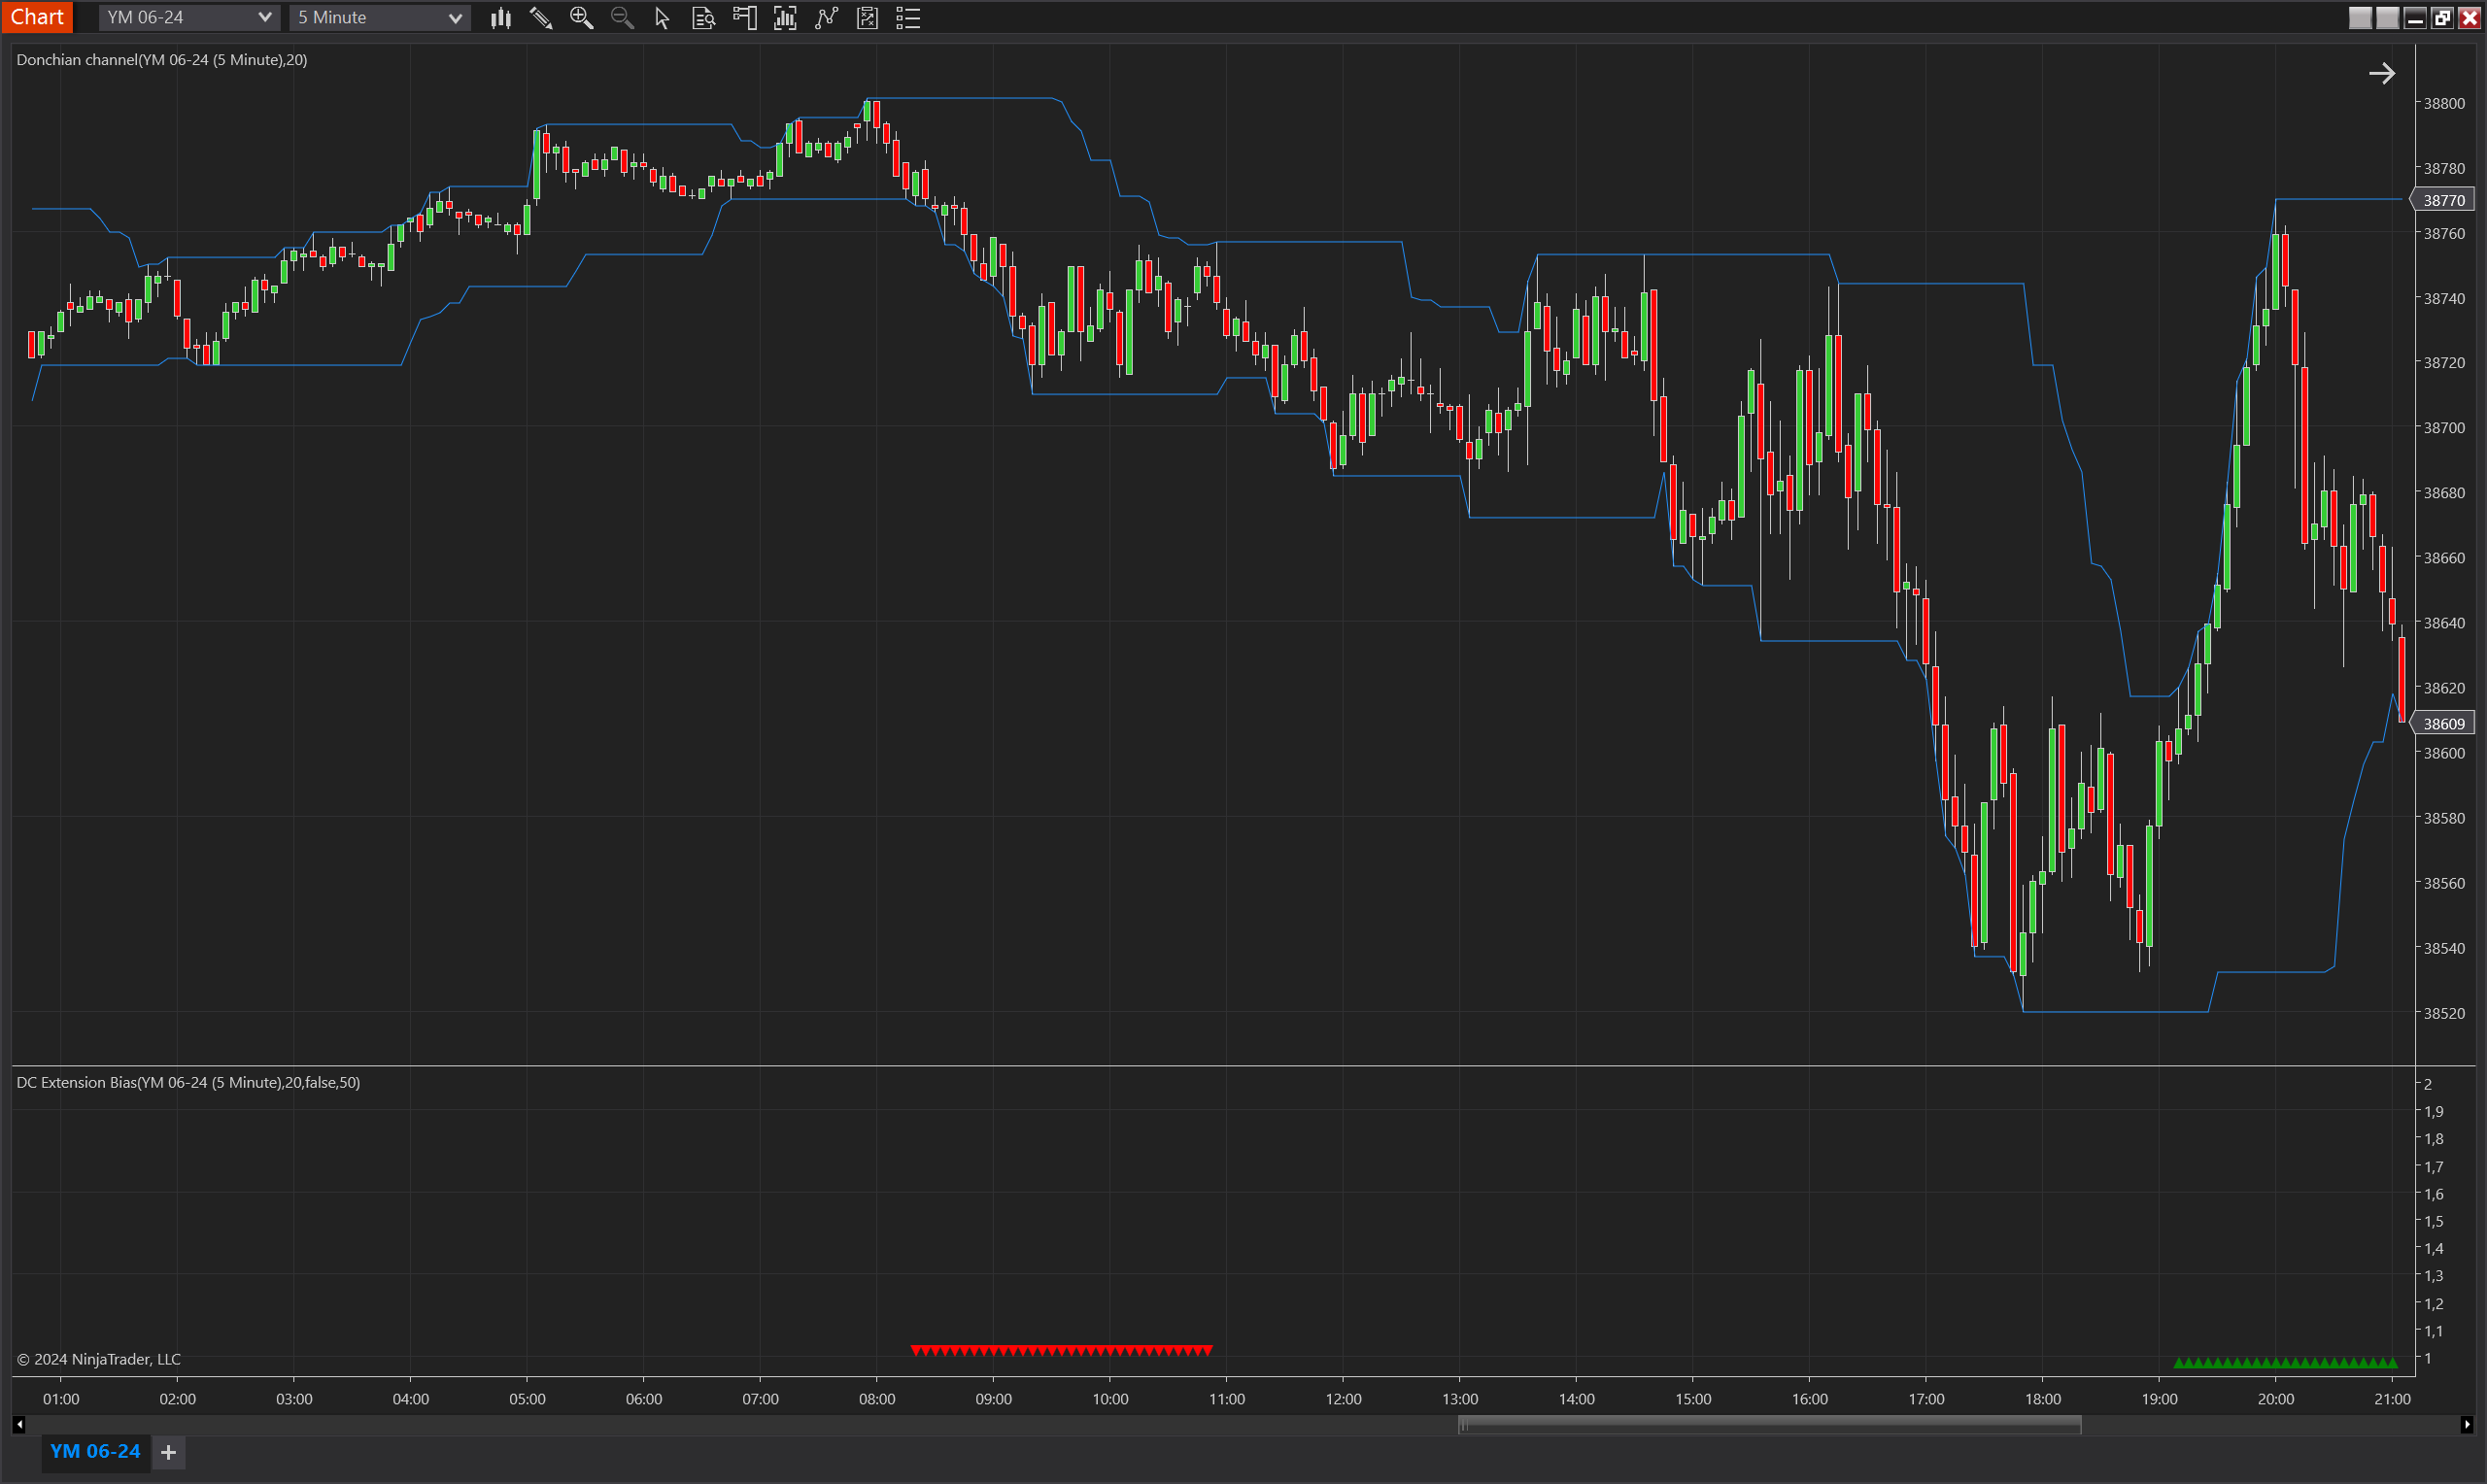
The DC Extension Bias is a dynamic indicator designed for the NinjaTrader 8 platform that leverages the Donchian Channel (DC) to detect bias in market trends. This indicator focuses on the extension movements of the Donchian Channel's upper and lower bands, identifying significant deviations from established levels. It captures the essence of market momentum by observing how often the bands fail to make new highs or lows over a specified period, signaling potential reversals or continuations.
Primarily, the DC Extension Bias is crafted to highlight scenarios where the lower band does not make a new low for a minimum number of bars, activating a downward bias when it finally does. The bias remains valid until the price reaches the base low level from which the bias was triggered, and until the upper band ceases to make higher highs, thus providing a robust framework for trading both reversals and breakouts.
Key Features
- Donchian Channel Utilization: Utilizes the Donchian Channel to identify significant market thresholds and trend continuations or reversals.
- Consecutive Band Tracking: Monitors consecutive periods where the Donchian Channel bands fail to reach new highs or lows, setting the stage for potential market shifts.
- Bias Validation: Ensures the validity of the bias until the price revisits the base level or the opposite band starts a new direction, adding a layer of confirmation to the signals.
- Flexible Adaptation: Includes an option to invert the bias direction, accommodating different trading styles and strategies, whether counter-trend or trend-following.
- Visual Indicators: Deploys visual cues on the chart, using upward and downward triangles to indicate the presence of an upward or downward bias, respectively.
Tips for Implementation
- Integrate with Price Action: Combine the DC Extension Bias signals with price action analysis to enhance decision-making. Look for candlestick patterns or other price formations at the levels indicated by the bias for confirmation.
- Adjust Parameters for Market Conditions: Tailor the DC period and the minimum extension requirements based on the volatility and typical price movements of the asset being traded.
- Leverage in Trend Analysis: Use the bias signals to identify potential starts of new trends or the exhaustion of current trends, particularly useful in volatile markets.
- Combine with Other Indicators: Enhance the effectiveness of the DC Extension Bias by combining it with volume indicators or oscillators like RSI or MACD to confirm the strength of the bias signals.
- Backtesting is Crucial: Always backtest the indicator with historical data specific to the instruments and timeframes you trade to optimize the settings and validate the strategy's effectiveness in real market conditions.
Parameters
DC Period
- Type: int
- Description: Specifies the number of bars used to calculate the Donchian Channel. This setting influences how sensitivity the channel reacts to price changes, impacting the identification of upper and lower thresholds.
- Default Value: 20
- Valid Values: Any positive integer greater than or equal to 1
Min DC Extension
- Type: int
- Description: The minimum number of consecutive bars where the Donchian Channel's upper or lower band must fail to make new highs or lows to trigger a bias. This parameter is crucial for defining the persistence of a trend before a bias is confirmed.
- Default Value: 100
- Valid Values: Any positive integer, typically set high to ensure the trend is well-established before signaling a bias.
Invert Bias Direction
- Type: bool
- Description: Allows users to invert the bias signals; typically used in strategies where the trader wishes to trade against the prevailing trend or for enhanced confirmation in complex trading setups.
- Default Value: false
- Options: true (Yes), false (No)
Plots
BiasUp
- Type: Plot
- Style: Triangle Up
- Color: Green
- Description: This plot represents the occurrence of a bullish bias. It is visualized as green triangles pointing upwards, each marking the confirmation of bullish conditions based on the indicator’s specific criteria. The presence of these triangles on the chart indicates that the bullish bias is active during the defined validity period.
BiasDown
- Type: Plot
- Style: Triangle Down
- Color: Red
- Description: This plot indicates a bearish bias, depicted as red triangles pointing downwards. Each triangle marks the realization of bearish conditions as determined by the indicator's criteria. The appearance of these triangles signifies that the bearish bias is maintained throughout the specified validity period.