Ema Fair Value Gap Bias
Description
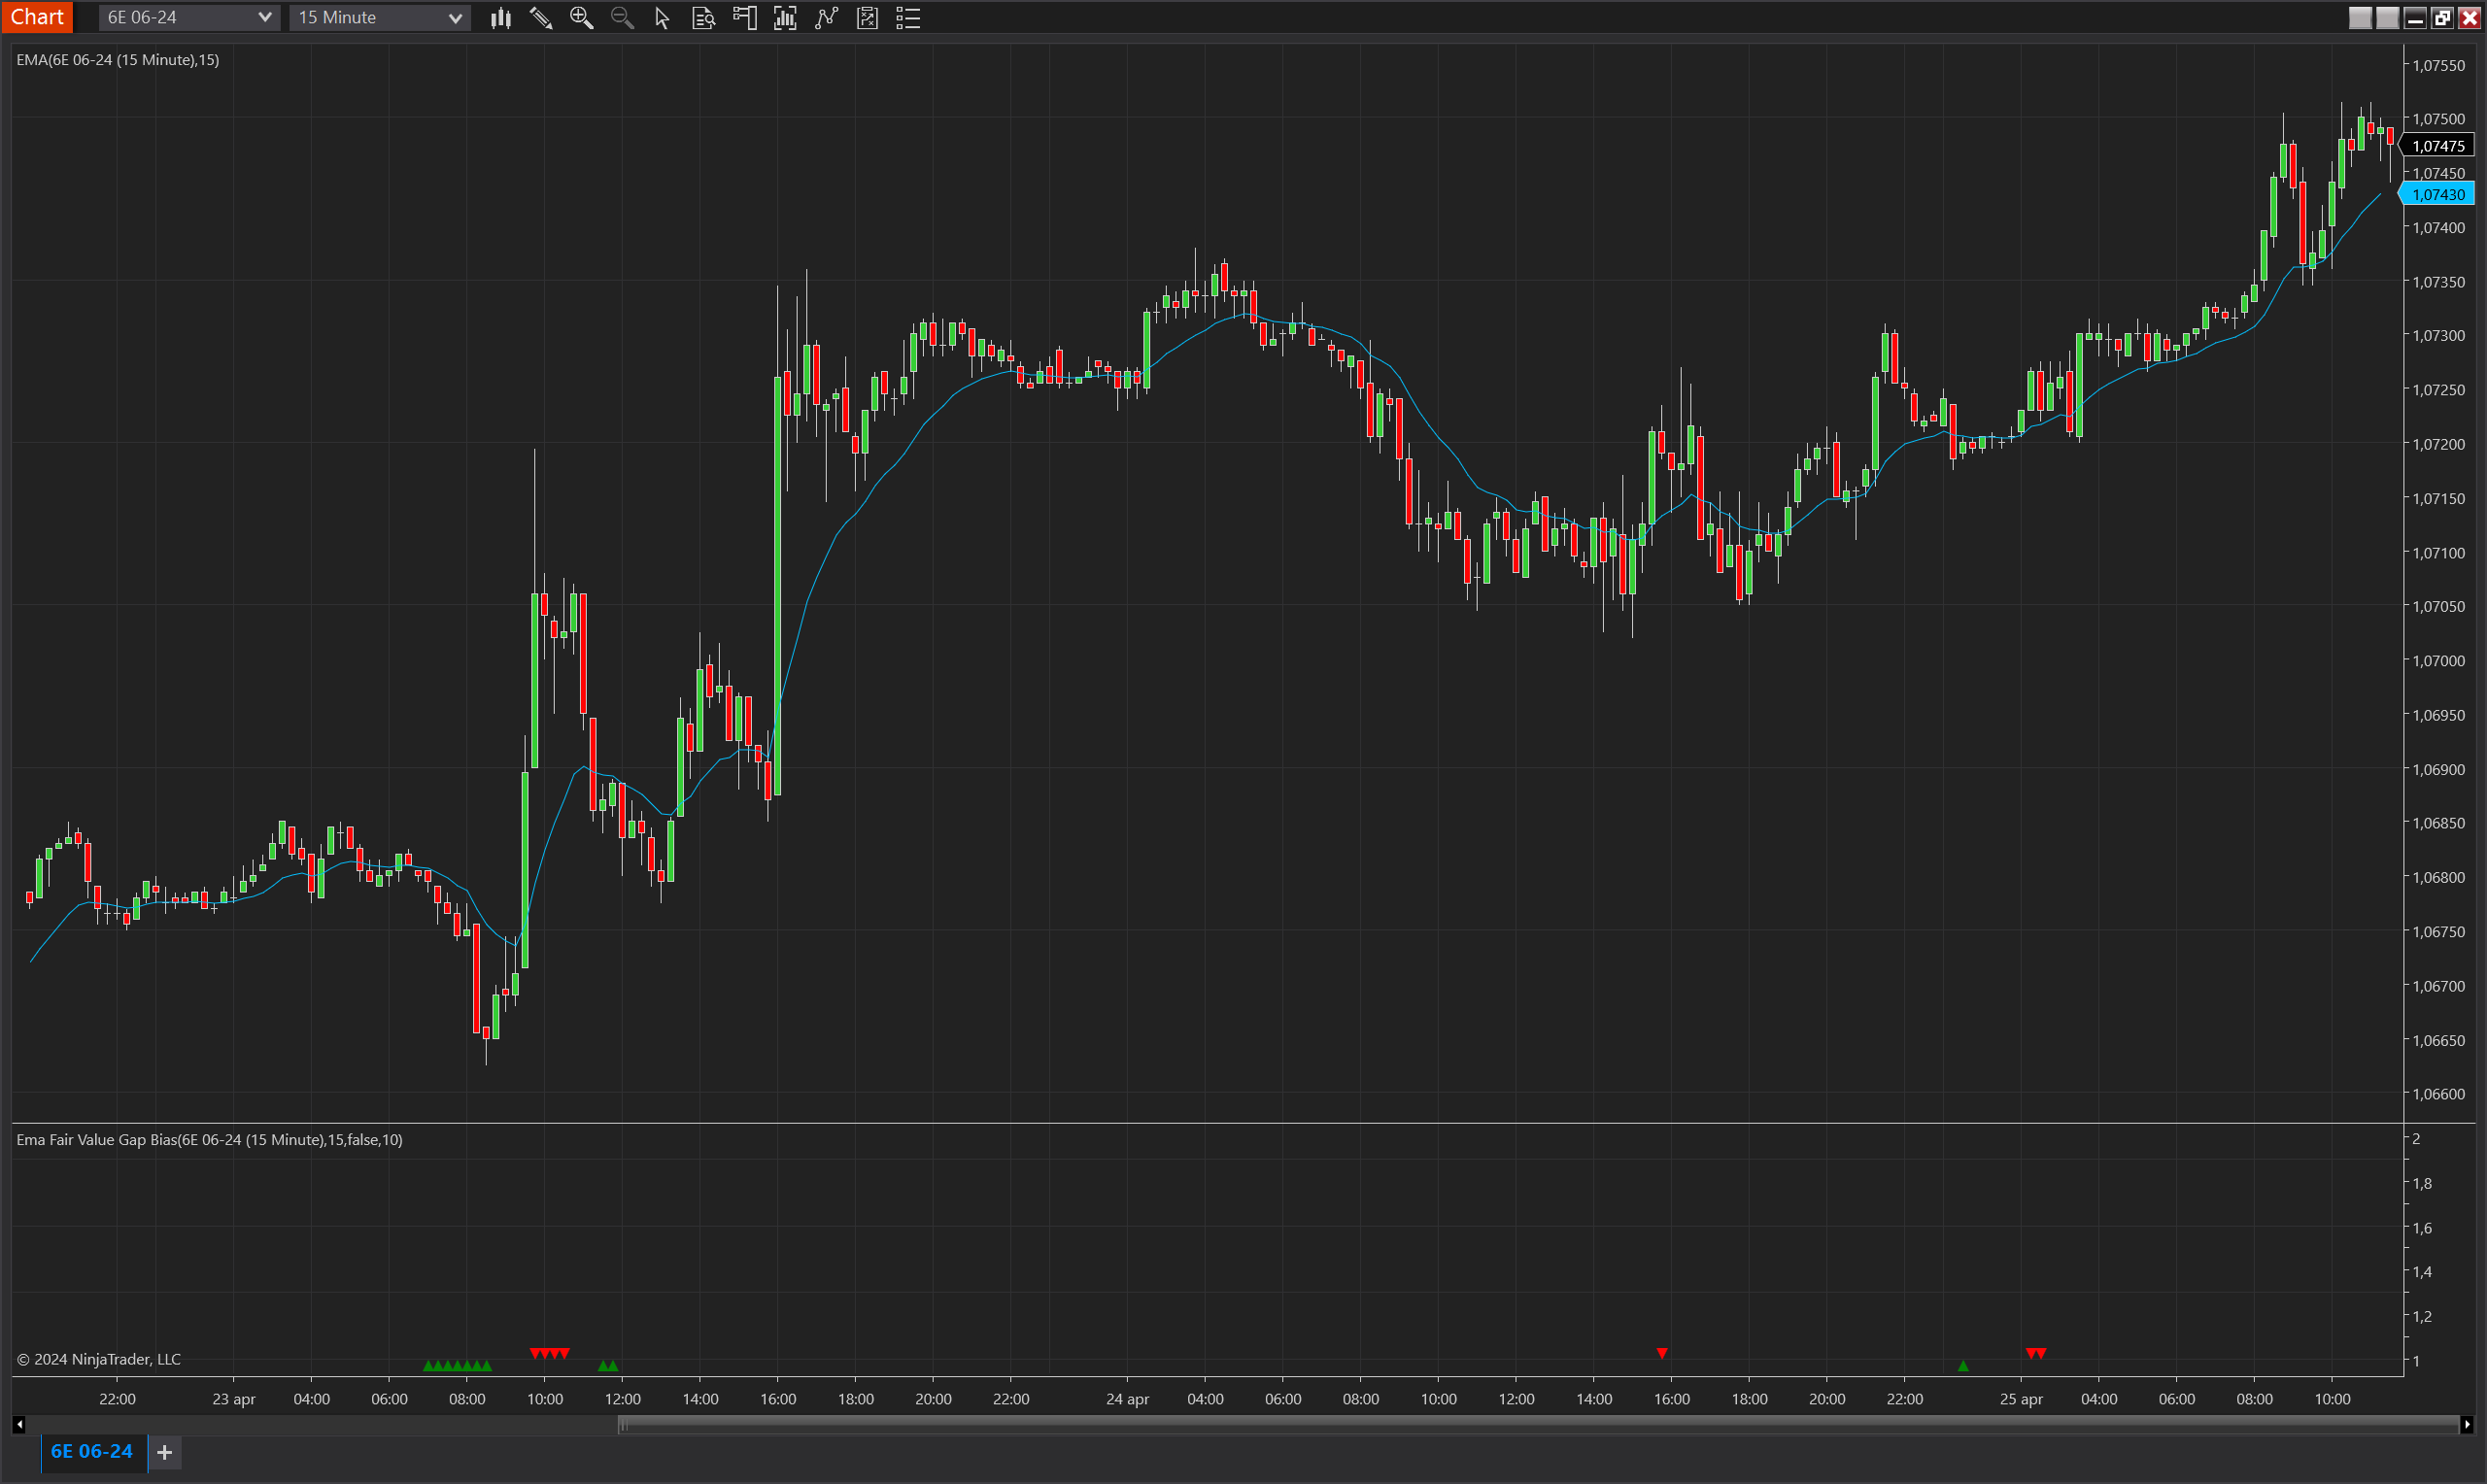
The EMA Fair Value Gap Bias is an innovative indicator designed specifically for NinjaTrader 8 to analyze market dynamics in ranging or lateral conditions. It effectively utilizes the concept of Fair Value Gaps (FVGs) — areas where price has skipped over without significant trading — in relation to an Exponential Moving Average (EMA). The indicator identifies an upward bias when an FVG occurs above the EMA and is further confirmed when a subsequent FVG appears below the EMA. This sequence helps traders to detect potential shifts in market conditions, providing insights into price imbalances and their relationship with the moving average. Conversely, a downward bias is indicated under the opposite conditions, making this tool highly versatile in assessing price direction relative to historical averages.
Key Features
- EMA-Based Analysis: Leverages an exponential moving average to establish a baseline for identifying fair value gaps, enhancing the reliability of bias detection.
- Fair Value Gap Detection: Captures moments where price leaps either above or below the EMA without significant trading, potentially indicating areas of market imbalance.
- Bias Activation and Validation: Includes mechanisms that not only activate but also validate the biases over a set period, ensuring that signals remain relevant and are based on sustained market conditions.
- Directional Flexibility: Features an option to invert the direction of the bias signals, accommodating different strategic approaches whether trading with the trend or counter-trend.
- Visual Signals: Utilizes green and red triangles to visually represent upward and downward biases, respectively, simplifying the interpretation and execution of trading decisions.
Tips for Implementation
- Integrate with Other Technical Tools: For enhanced trading strategies, combine the EMA Fair Value Gap Bias with other technical analysis tools such as RSI, MACD, or Volume Oscillators to confirm signals and refine entry and exit points.
- Adjust EMA and Validity Parameters: Customize the EMA period and the maximum validity duration to align with specific trading styles and the volatility characteristics of the traded asset.
- Market Condition Consideration: While the indicator is tailored for ranging markets, assessing the overall market condition can help in deciding when to rely more heavily on the signals provided.
- Backtesting for Optimization: To maximize effectiveness, backtest the indicator under various market scenarios to understand how different settings impact the predictive accuracy and adapt the strategy accordingly.
- Real-Time Confirmation: Use real-time price action to confirm the bias signals, particularly looking for closing prices relative to the EMA and subsequent FVG formations to ensure robust trading decisions.
Parameters
Ema Period
- Type: int
- Description: Specifies the period over which the Exponential Moving Average (EMA) is calculated. This setting affects the sensitivity of the EMA to price changes, with shorter periods reacting more quickly to market movements.
- Default Value: 8
- Valid Values: Any positive integer greater than or equal to 1
Max Validity
- Type: int
- Description: Defines the maximum number of bars for which a bias signal remains valid after activation. This parameter helps to manage the duration over which the bias is considered actionable before it needs reevaluation.
- Default Value: 10
- Valid Values: Any positive integer greater than or equal to 1
Invert Bias Direction
- Type: bool
- Description: Allows the user to invert the direction of the bias signals. This feature can be used to adapt the indicator for different trading strategies, such as counter-trend approaches.
- Default Value: false
- Options: true (Yes), false (No)
Plots
BiasUp
- Type: Plot
- Style: Triangle Up
- Color: Green
- Description: This plot represents the occurrence of a bullish bias. It is visualized as green triangles pointing upwards, each marking the confirmation of bullish conditions based on the indicator’s specific criteria. The presence of these triangles on the chart indicates that the bullish bias is active during the defined validity period.
BiasDown
- Type: Plot
- Style: Triangle Down
- Color: Red
- Description: This plot indicates a bearish bias, depicted as red triangles pointing downwards. Each triangle marks the realization of bearish conditions as determined by the indicator's criteria. The appearance of these triangles signifies that the bearish bias is maintained throughout the specified validity period.