Stochastics Bias
Description
The Stochastics Bias indicator is a powerful tool for identifying market bias using the Stochastics oscillator. It generates signals indicating potential bullish or bearish market conditions based on customizable overbought and oversold levels. This indicator helps traders refine their entry points by monitoring the Stochastics' movements within these critical zones and tracking bar counts upon exiting these zones. Additionally, the indicator includes features like bias validity periods and the ability to invert signals for trend-following or counter-trend strategies, making it highly versatile for different trading strategies.
Key Features
- Overbought and Oversold Monitoring: Tracks Stochastics levels relative to customizable overbought and oversold thresholds, providing visual cues for potential market reversals.
- Bias Validity Period: Allows setting the number of bars for which a bias signal remains valid, helping traders manage trade timing.
- Opposite Zone Exit Counting: Counts the bars after the Stochastics exits the overbought/oversold zones, aiding in the confirmation of bias signals.
- Invert Signal Direction: Offers the option to invert bias signals, useful for both trend-following and counter-trend trading strategies.
Tips for Implementation
- Strategic Confirmation: Pair the indicator's signals with key support and resistance levels for stronger trade confirmation.
- Volatility Assessment: Use in conjunction with volatility measures to ensure signals are aligned with the current market environment.
- Parameter Customization: Adjust the overbought/oversold levels and validity periods to better fit your specific trading timeframe and strategy.
- Complementary Indicators: Consider using with other indicators like RSI or Moving Averages to validate signals further.
- Backtesting: Always backtest the indicator across different market conditions to fine-tune its settings and verify its effectiveness within your trading strategy.
Parameters
Period:
- Type: int
- Description: Defines the number of bars used to calculate the %K line of the Stochastics oscillator.
- Default Value: 14
- Valid Values: 1 to any positive integer.
Oversold Level:
- Type: int
- Description: The threshold below which the Stochastics is considered oversold, triggering potential BiasUp signals.
- Default Value: 30
- Valid Values: 1 to any positive integer.
Overbought Level:
- Type: int
- Description: The threshold above which the Stochastics is considered overbought, triggering potential BiasDown signals.
- Default Value: 70
- Valid Values: 1 to any positive integer.
Max Opposite Zone Exit Count:
- Type: int
- Description: The maximum number of bars counted when the Stochastics exits the overbought/oversold zone, used to confirm bias when it re-enters the opposite zone.
- Default Value: 5
- Valid Values: 1 to any positive integer.
Max Bias Validity:
- Type: int
- Description: The number of bars for which a bias signal remains valid.
- Default Value: 5
- Valid Values: 1 to any positive integer.
Invert Bias Direction:
- Type: bool
- Description: Allows the trader to invert the signal direction, enabling the indicator’s use for both following and counteracting the prevailing trend.
- Default Value: false
- Options: true (Yes), false (No)
Plots
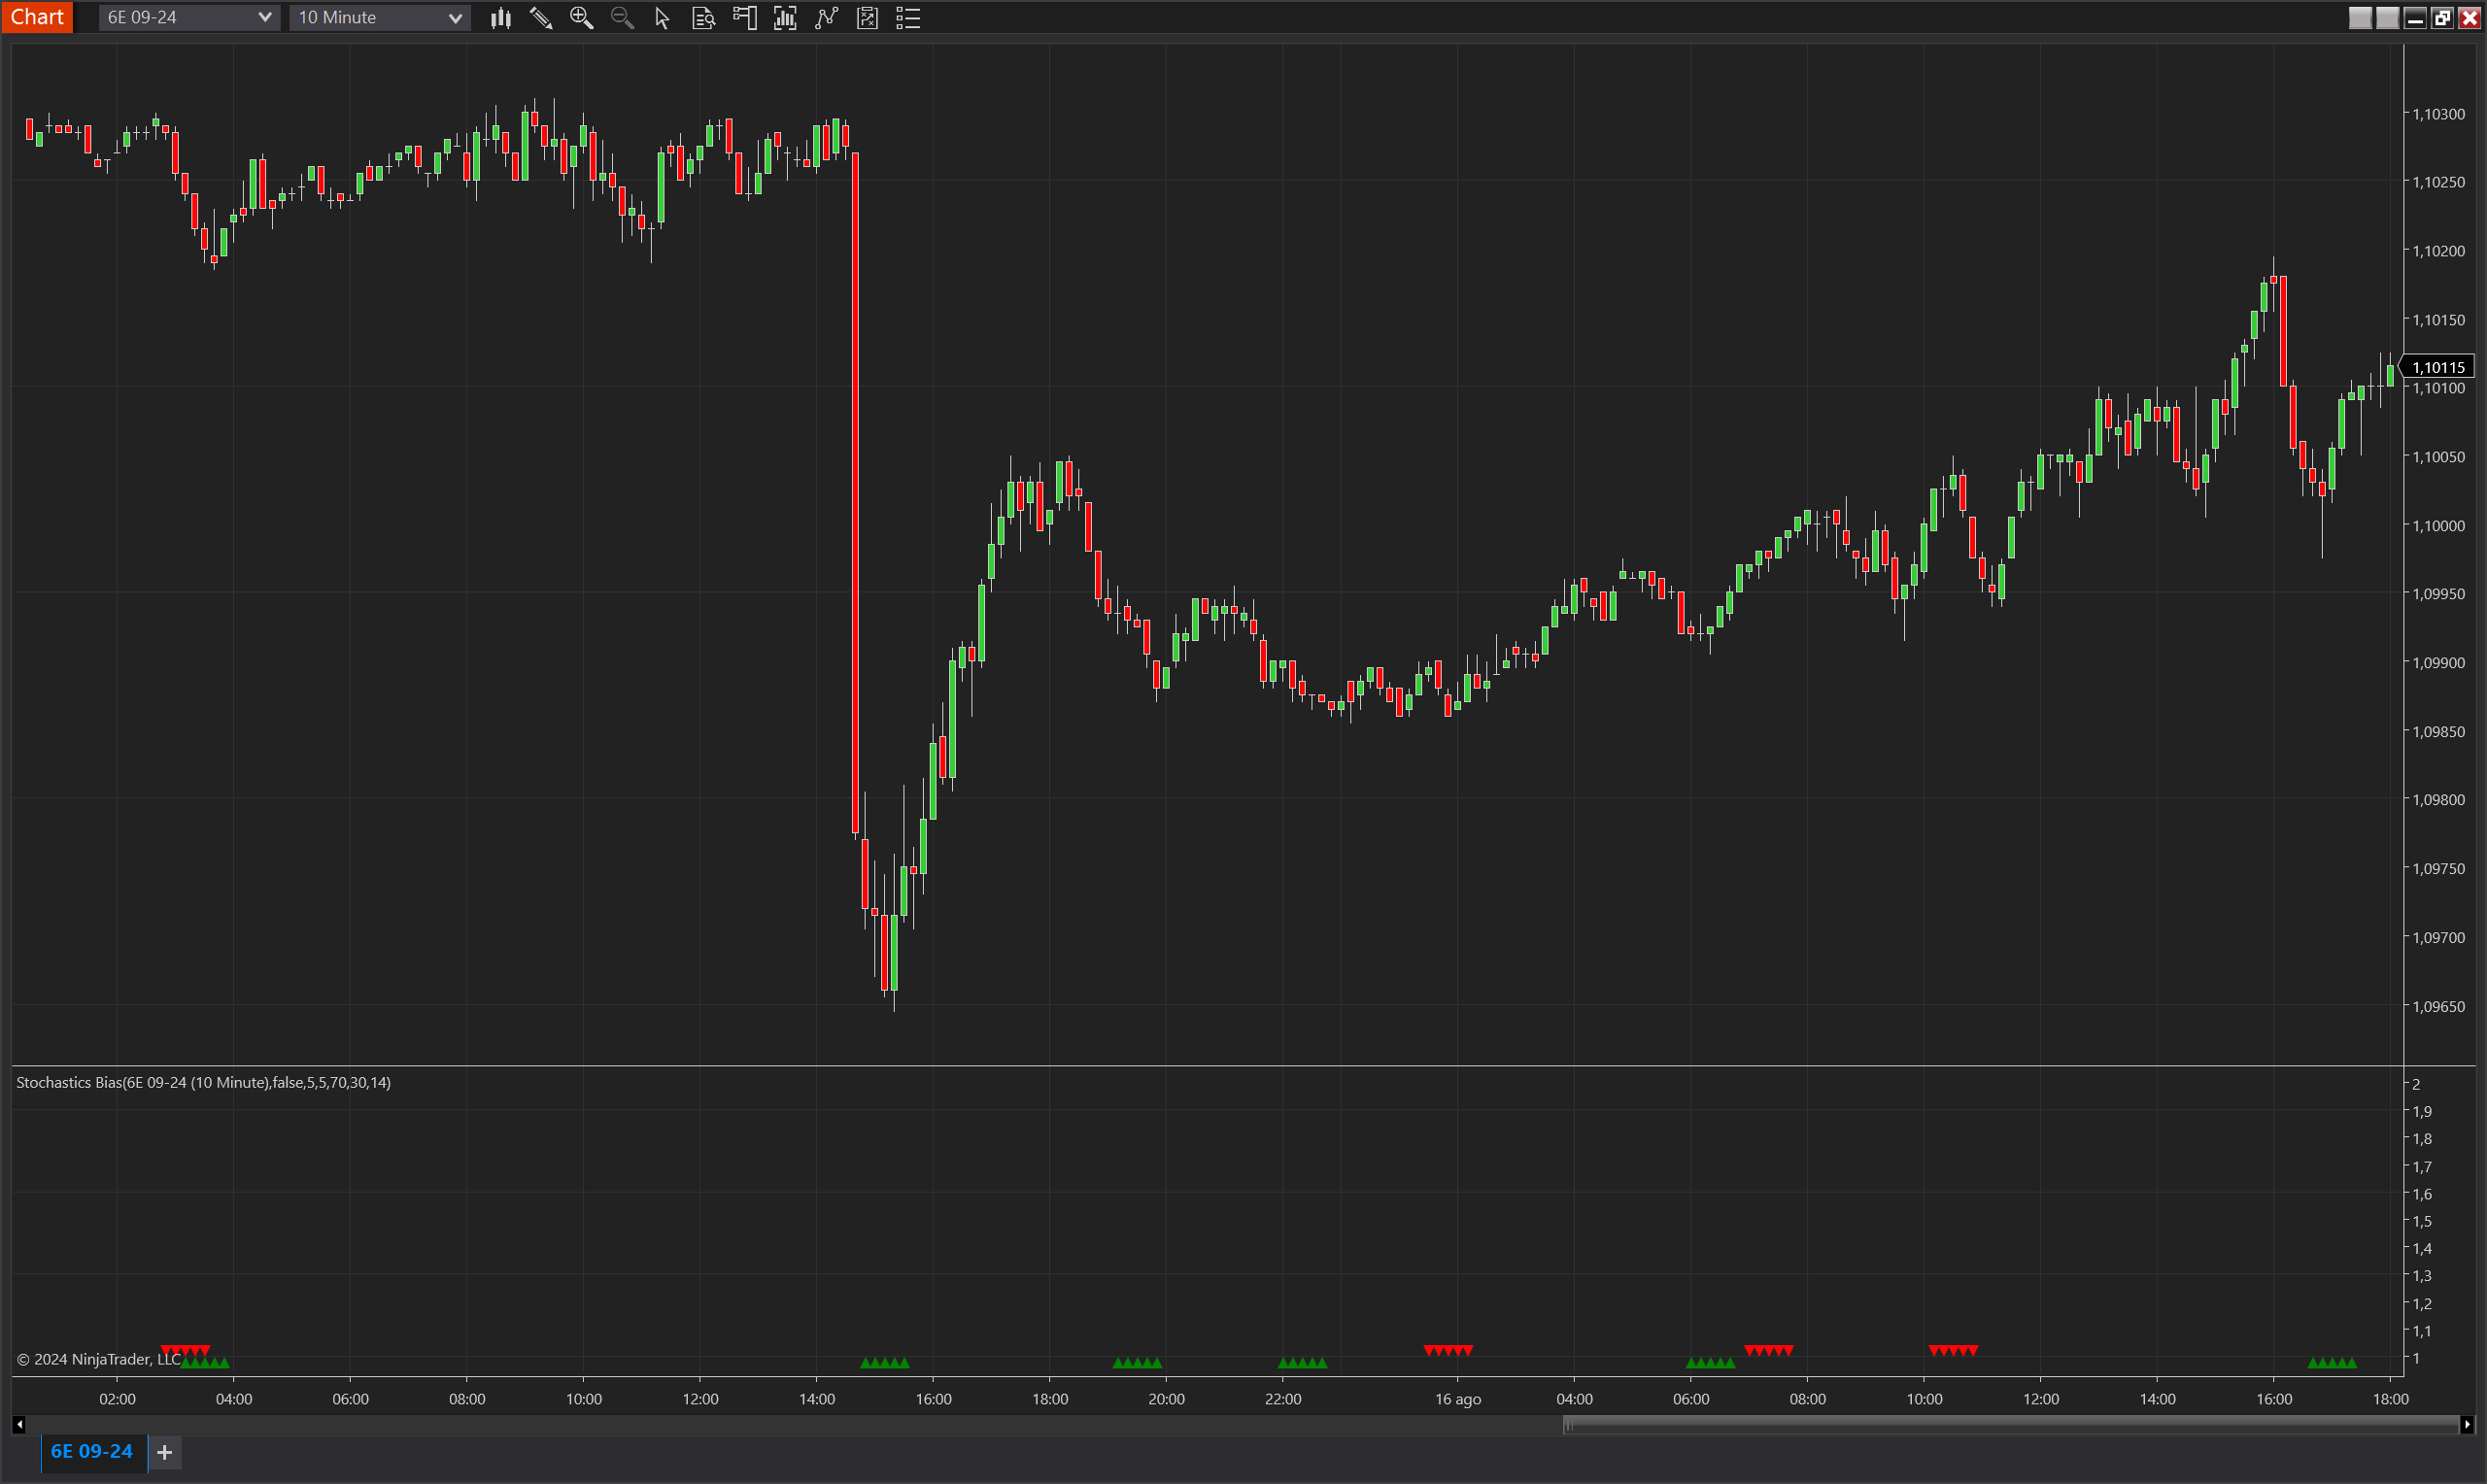
BiasUp
- Type: Plot
- Style: Triangle Up
- Color: Green
- Description: Represents the occurrence of a bullish bias, visualized as green triangles pointing upwards. These triangles indicate active bullish conditions based on the indicator's criteria, lasting for the defined validity period.
BiasDown
- Type: Plot
- Style: Triangle Down
- Color: Red
- Description: Represents the occurrence of a bearish bias, visualized as red triangles pointing downwards. These triangles indicate active bearish conditions, with the bearish bias persisting through the validity period.