Consecutive MA Gap Plus Bias
Description
The Consecutive MA Gap Plus Bias is an enhanced version of the Consecutive MA Gap Bias indicator for NinjaTrader 8. It incorporates additional filters to provide a more nuanced view of market bias. The indicator measures the gap between price and a moving average, alongside new extremes beyond a Donchian Channel and the percentage of directional bars, to identify a bullish or bearish bias. The key advantage is its ability to filter out noise and focus on significant trends by accounting for both the number of new highs or lows and the strength of long or short bars.
Key Features
- Advanced Filtering: Utilizes Donchian Channels to filter market extremes and identify significant trends.
- New Extremes Percentage: Quantifies the proportion of bars reaching new highs or lows to validate trend strength.
- Directional Bar Analysis: Assesses the percentage of bars closing higher or lower than their open, further confirming the established bias.
- Bias Direction Control: Offers the ability to invert bias signals, allowing traders to align the indicator with their unique strategies or to act as a contrarian signal.
- Customizable Thresholds: Traders can set thresholds for consecutive counts and minimum percentages to trigger bias indications.
Tips for Implementation
- Strategy Integration: Combine the Consecutive MA Gap Plus Bias indicator with other analysis tools, such as momentum oscillators or trend-following strategies, to corroborate signals.
- Volume Confirmation: Enhance the indicator's signals by checking them against volume data; significant biases should coincide with high trading volumes.
- Threshold Tuning: Fine-tune the consecutive threshold and percentage parameters to match the volatility and trading frequency of the asset being traded.
- Bias Direction Adjustments: Leverage the invert bias feature when using the indicator in mean-reversion strategies or to detect potential trend reversals.
Visualization
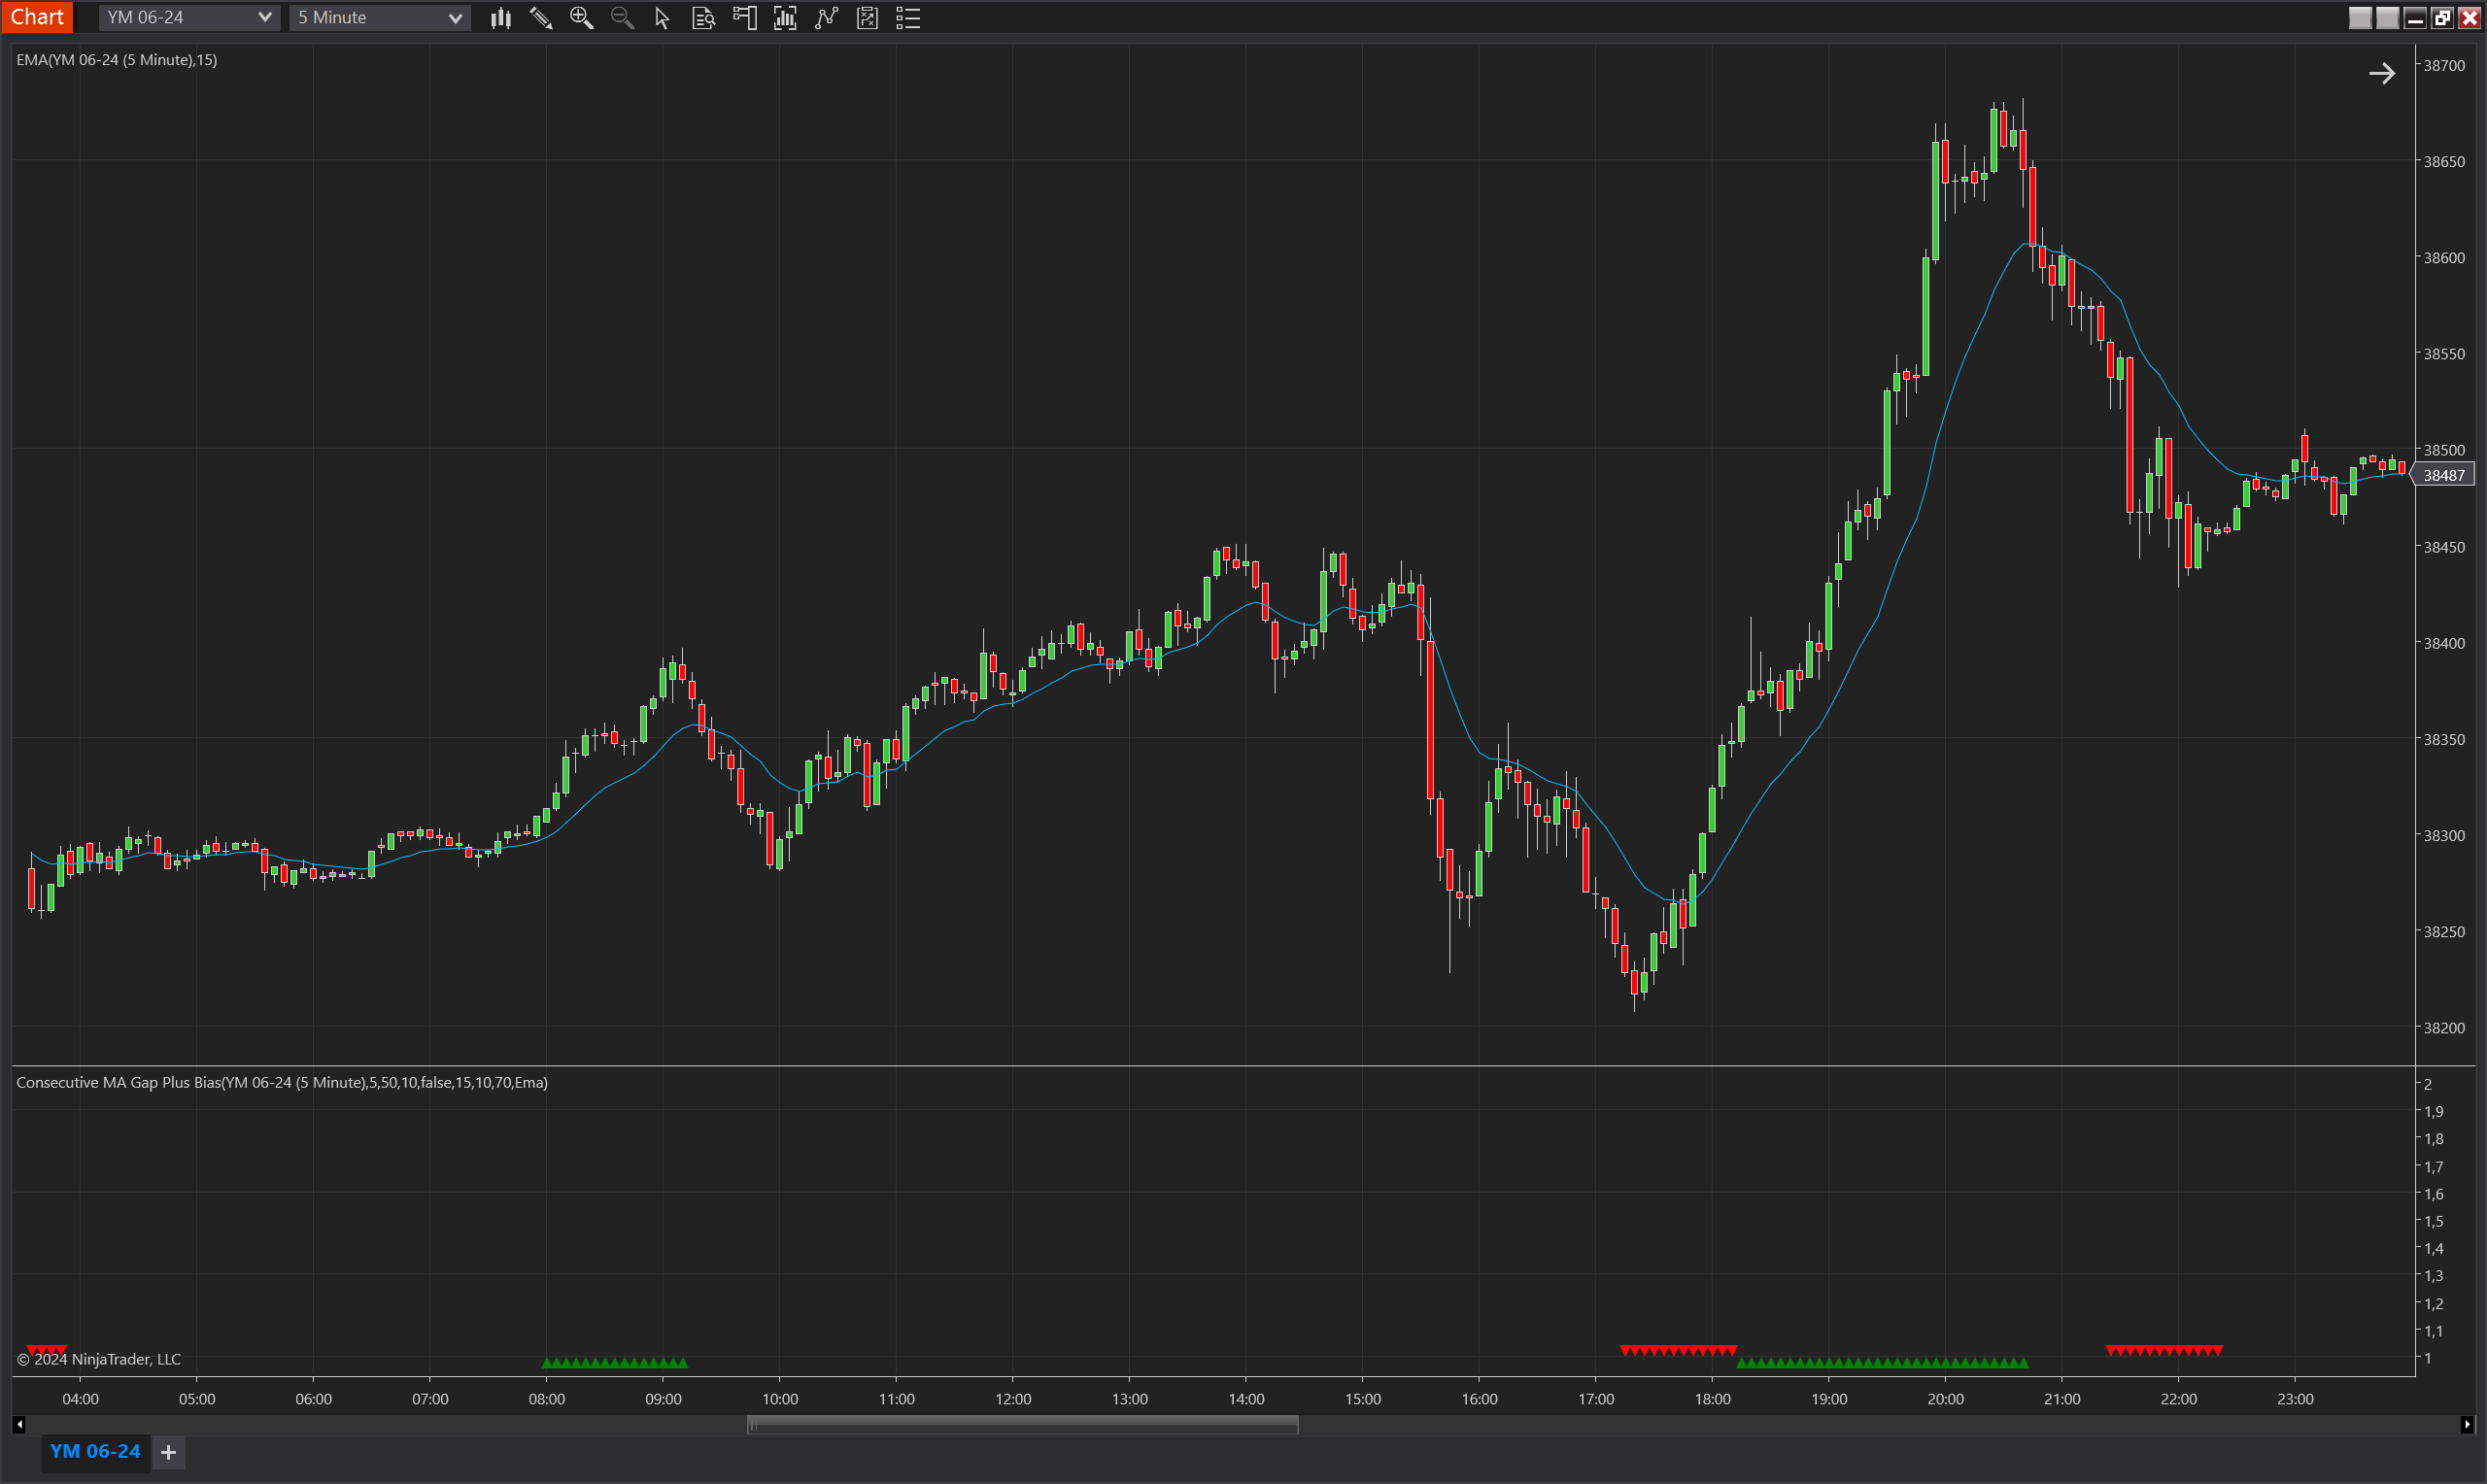
The indicator is visualized with upward green triangles to represent a bullish bias and downward red triangles for a bearish bias. These are plotted when conditions within the defined parameters are met, providing clear visual cues for traders to act upon.
By accounting for both the moving average gap and the market's effort to reach new price extremes, the Consecutive MA Gap Plus Bias indicator serves as a powerful tool for discerning traders looking to isolate true market bias from the broader price action.
Parameters
MA Period
- Type: int
- Description: The number of bars used for calculating the moving average, which is central to determining the gap for the bias.
- Default Value: 15
- Valid Values: Any positive integer
Moving Average Type
- Type: TdjMovingAverageProperties.MovingAverageType
- Description: Specifies the type of moving average applied, such as Exponential (EMA), Simple (SMA), or Double Exponential (DEMA).
- Default Value: Ema (Exponential Moving Average)
- Options: Ema, Dema, Sma
Consecutive Threshold
- Type: int
- Description: The minimum number of consecutive bars required above or below the moving average to define a trend direction.
- Default Value: 5
- Valid Values: Any positive integer
DC Period
- Type: int
- Description: Defines the period over which the Donchian Channel is calculated, used for identifying new price extremes.
- Default Value: 20
- Valid Values: Any positive integer
DC Min New Extremes Percentage
- Type: int
- Description: The minimum percentage of bars that must make new extremes beyond the Donchian Channel for a bias to be confirmed.
- Default Value: 70
- Valid Values: 1 to 100
Min Direction Bars Percentage
- Type: int
- Description: The minimum percentage of bars that must close in the same direction relative to their open for a trend bias to be confirmed.
- Default Value: 70
- Valid Values: 1 to 100
Max Bias Validity
- Type: int
- Description: The maximum number of bars for which a bias is considered valid once established.
- Default Value: 5
- Valid Values: Any positive integer
Invert Bias Direction
- Type: bool
- Description: If set to true, the bias direction is inverted; a bullish bias is shown as bearish and vice versa, which can be useful for counter-trend strategies.
- Default Value: false
- Options: true (Yes), false (No)
Plots
BiasUp
- Type: Plot
- Style: Triangle Up
- Color: Green
- Description: This plot represents the occurrence of a bullish bias. It is visualized as green triangles pointing upwards, each marking the confirmation of bullish conditions based on the indicator’s specific criteria. The presence of these triangles on the chart indicates that the bullish bias is active during the defined validity period.
BiasDown
- Type: Plot
- Style: Triangle Down
- Color: Red
- Description: This plot indicates a bearish bias, depicted as red triangles pointing downwards. Each triangle marks the realization of bearish conditions as determined by the indicator's criteria. The appearance of these triangles signifies that the bearish bias is maintained throughout the specified validity period.