Ema Stretch Bias
Description
The EMA Stretch Bias is an innovative indicator designed for the NinjaTrader 8 platform, aimed at identifying potential shifts in market dynamics relative to an Exponential Moving Average (EMA). This indicator triggers when the price creates a significant gap from the EMA, which is considered a potential divergence indicative of an upcoming volatility increase or trend shift. The EMA Stretch Bias is particularly useful in volatile markets where rapid price movements can occur, providing traders with early signals of stretching away from the average price, suggesting a possible reversal or continuation of the trend.
The bias is activated when the price stretches beyond a predefined ATR-based gap from the EMA and is confirmed when it crosses to the opposite side of the EMA, creating a similar stretch. This pattern of price behaviour indicates a pulling away from the norm, which can be crucial for traders looking for dynamic entry and exit points.
Key Features
- EMA and ATR Utilization: Leverages an Exponential Moving Average (EMA) for trend tracking and an Average True Range (ATR) to gauge volatility and set stretch thresholds.
- Stretch Activation: Identifies when the price significantly deviates from the EMA by a factor of the ATR, signalling a potential change in market conditions.
- Bias Validation and Duration: The bias remains active for a predefined number of bars, allowing traders to capitalize on the stretch before reassessment.
- Directional Versatility: Includes an option to invert the direction of the bias signals, accommodating different market perspectives and trading strategies.
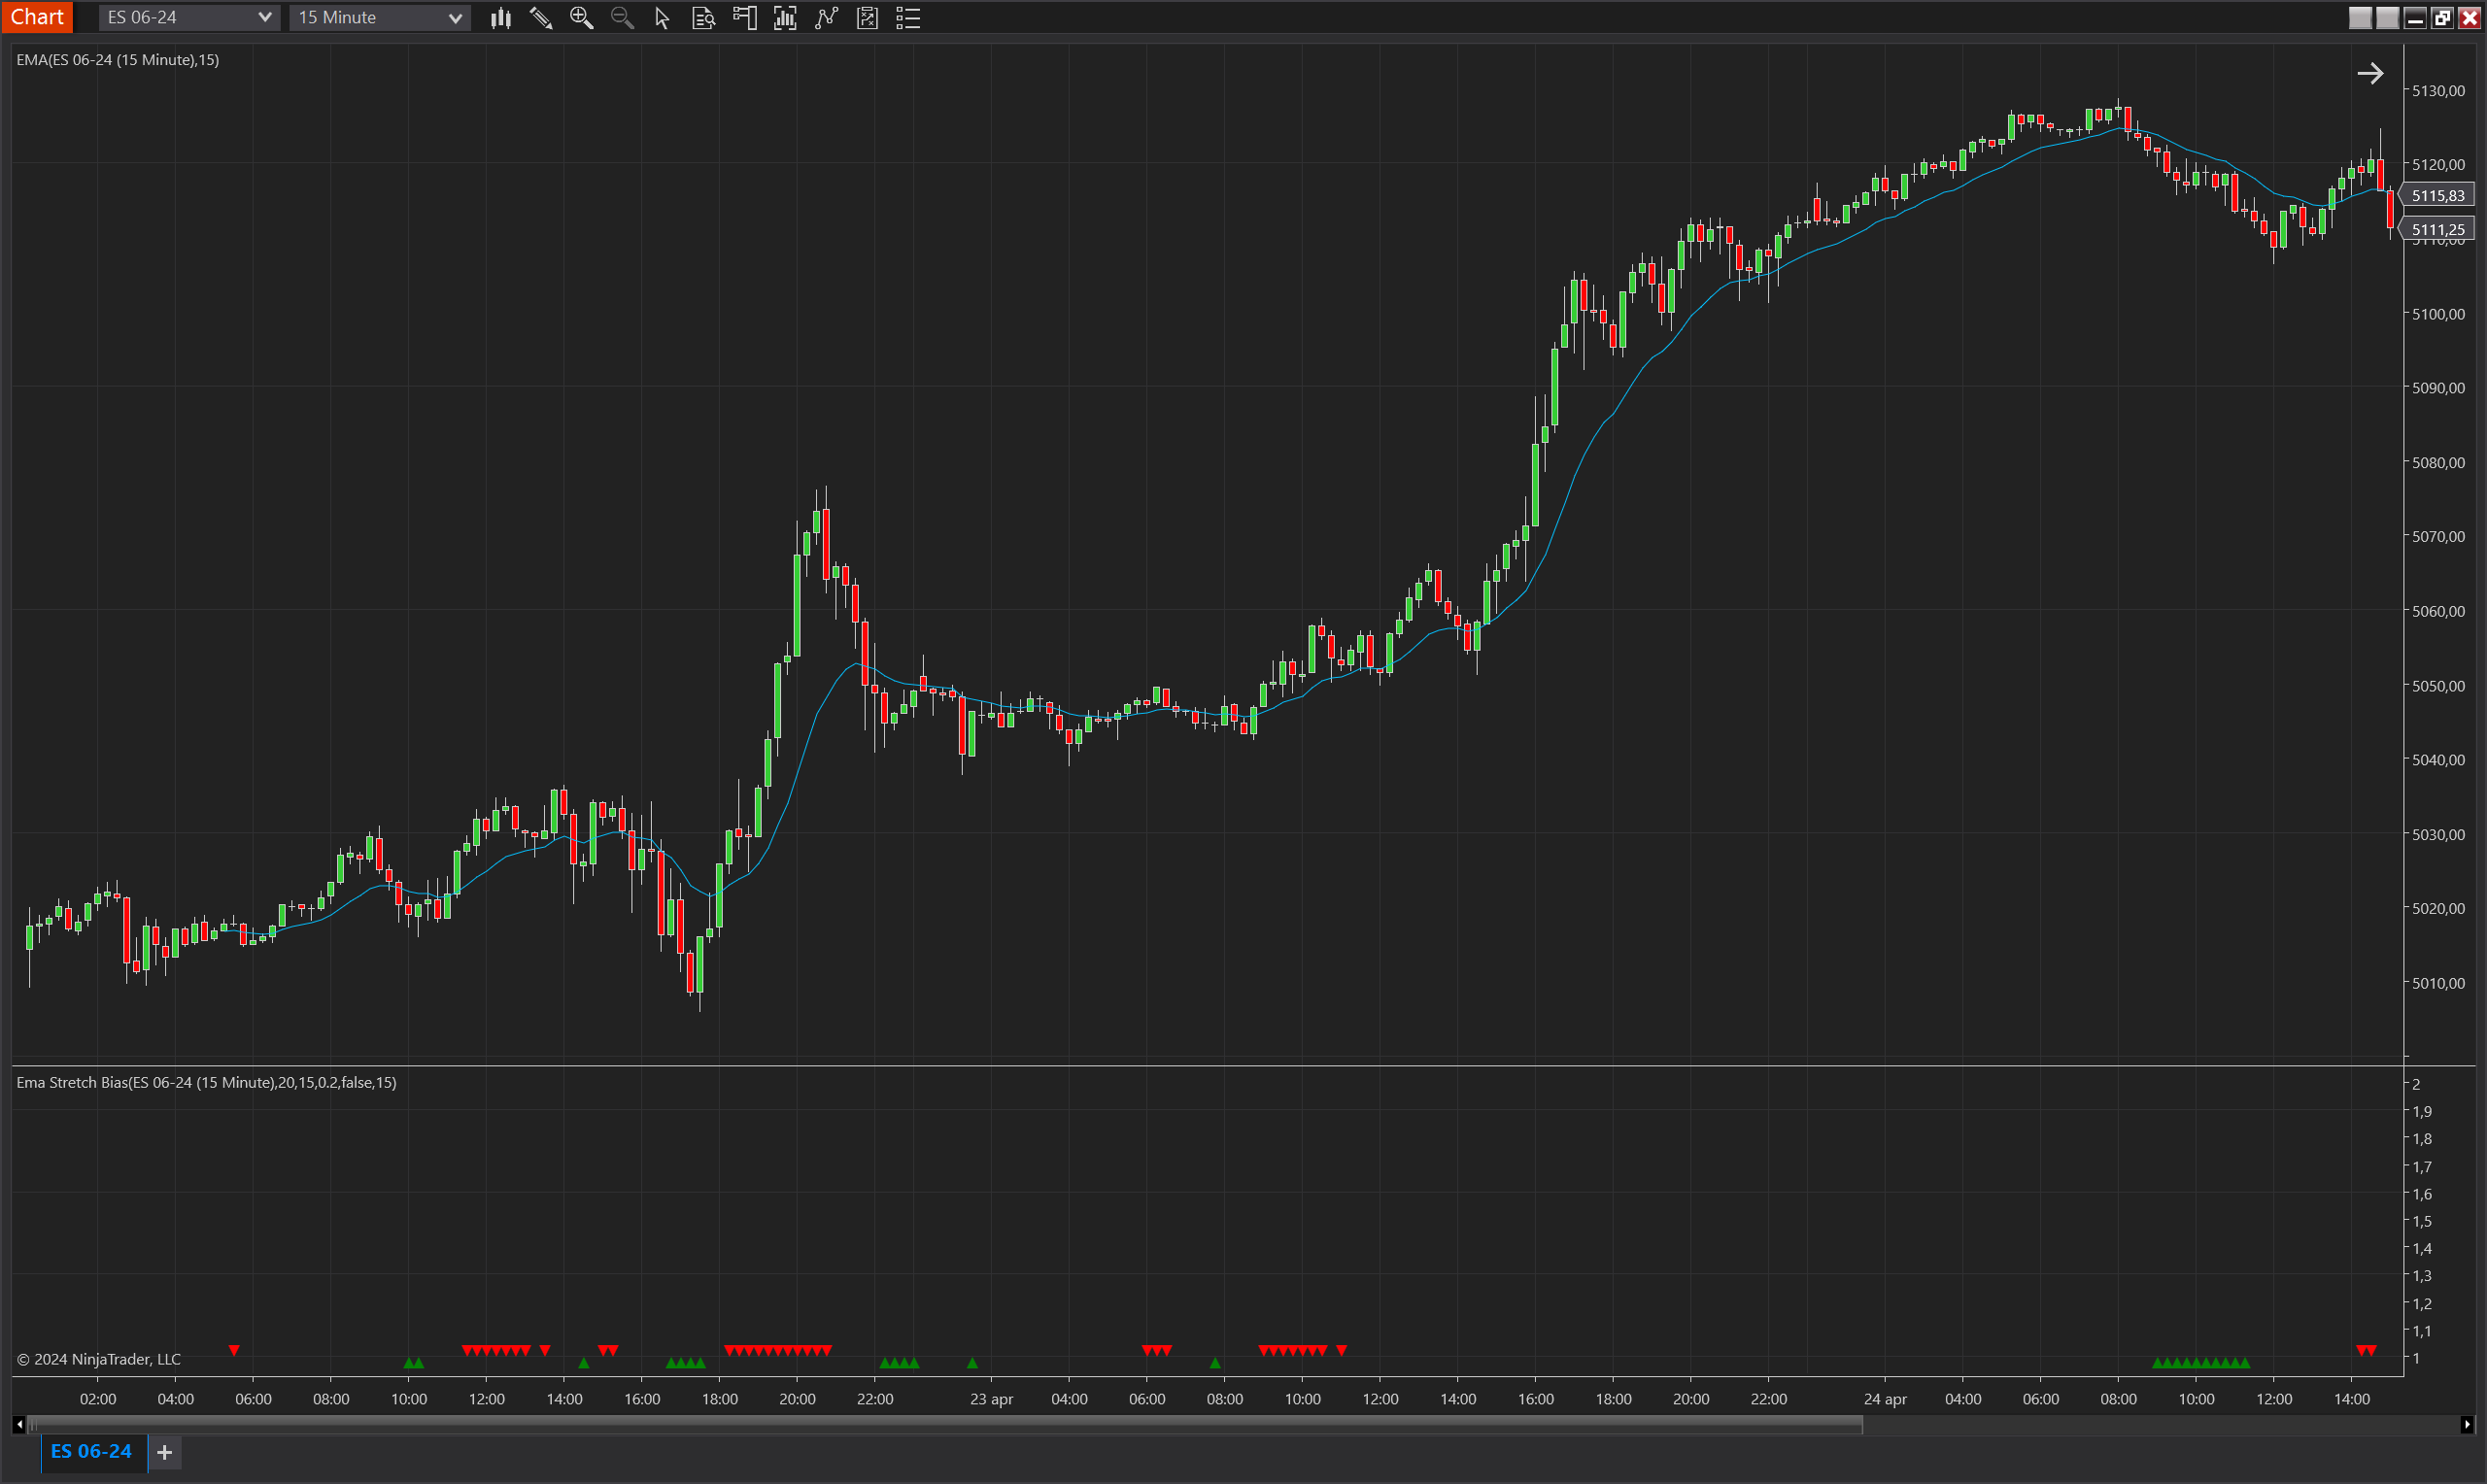
- Visual Signals: Uses coloured triangles to indicate the direction of the bias, providing clear, actionable visual cues directly on the trading chart.
Tips for Implementation
- Complementary Strategies: Integrate the EMA Stretch Bias with other indicators such as momentum oscillators, volume indicators, or other forms of price action analysis to confirm the strength and potential sustainability of the identified stretch.
- Parameter Adjustments: Customize the EMA and ATR periods as well as the gap multiplier to suit the specific characteristics of the asset being traded, such as volatility and typical price movements.
- Market Condition Sensitivity: Utilize this indicator more effectively during market conditions known for volatility, where price stretches are more likely to signify meaningful market moves.
- Risk Management: Employ stringent risk management protocols when trading on biases indicated by the EMA Stretch Bias, considering the increased market volatility that may accompany such signals.
- Backtesting: Prior to live implementation, backtest the indicator across various market scenarios and time frames to validate its effectiveness and to fine-tune its settings according to historical performance.
Parameters
Ema Period
- Type: int
- Description: Specifies the number of bars used to calculate the Exponential Moving Average (EMA). This setting determines how closely the EMA tracks price movements, influencing the sensitivity of the bias detection.
- Default Value: 8
- Valid Values: Any positive integer greater than or equal to 1, where a lower value results in a more responsive EMA.
Atr Period
- Type: int
- Description: Defines the lookback period for calculating the Average True Range (ATR), which is used to set the gap thresholds for bias activation. The ATR measures market volatility, with a higher period providing a smoothed average.
- Default Value: 20
- Valid Values: Any positive integer, with higher values smoothing volatility measurements over a longer period.
Gap Min Atr Multiple
- Type: double
- Description: Determines the minimum multiplier of the ATR that the price must exceed away from the EMA to activate a bias signal. This value sets the threshold for what constitutes a significant 'stretch' from the EMA.
- Default Value: 0.2
- Valid Values: Any non-negative decimal, where a higher value indicates a larger required deviation from the EMA for bias activation.
Max Validity
- Type: int
- Description: The maximum number of bars for which a triggered bias is considered valid. This parameter allows traders to control the duration over which the bias signal remains active, reflecting their trading horizon and risk tolerance.
- Default Value: 10
- Valid Values: Any positive integer, where a higher value extends the influence of a bias signal over more bars.
Invert Bias Direction
- Type: bool
- Description: Allows for the inversion of the bias signals, where an upward bias becomes a downward signal and vice versa. This feature is useful for traders employing counter-trend strategies or those who interpret overextensions as reversal signals.
- Default Value: false
- Options: true (Yes), false (No), enabling flexibility in how the bias indications are applied in trading strategies.
Plots
BiasUp
- Type: Plot
- Style: Triangle Up
- Color: Green
- Description: This plot represents the occurrence of a bullish bias. It is visualized as green triangles pointing upwards, each marking the confirmation of bullish conditions based on the indicator’s specific criteria. The presence of these triangles on the chart indicates that the bullish bias is active during the defined validity period.
BiasDown
- Type: Plot
- Style: Triangle Down
- Color: Red
- Description: This plot indicates a bearish bias, depicted as red triangles pointing downwards. Each triangle marks the realization of bearish conditions as determined by the indicator's criteria. The appearance of these triangles signifies that the bearish bias is maintained throughout the specified validity period.