Daily Surge Load Bias
Description
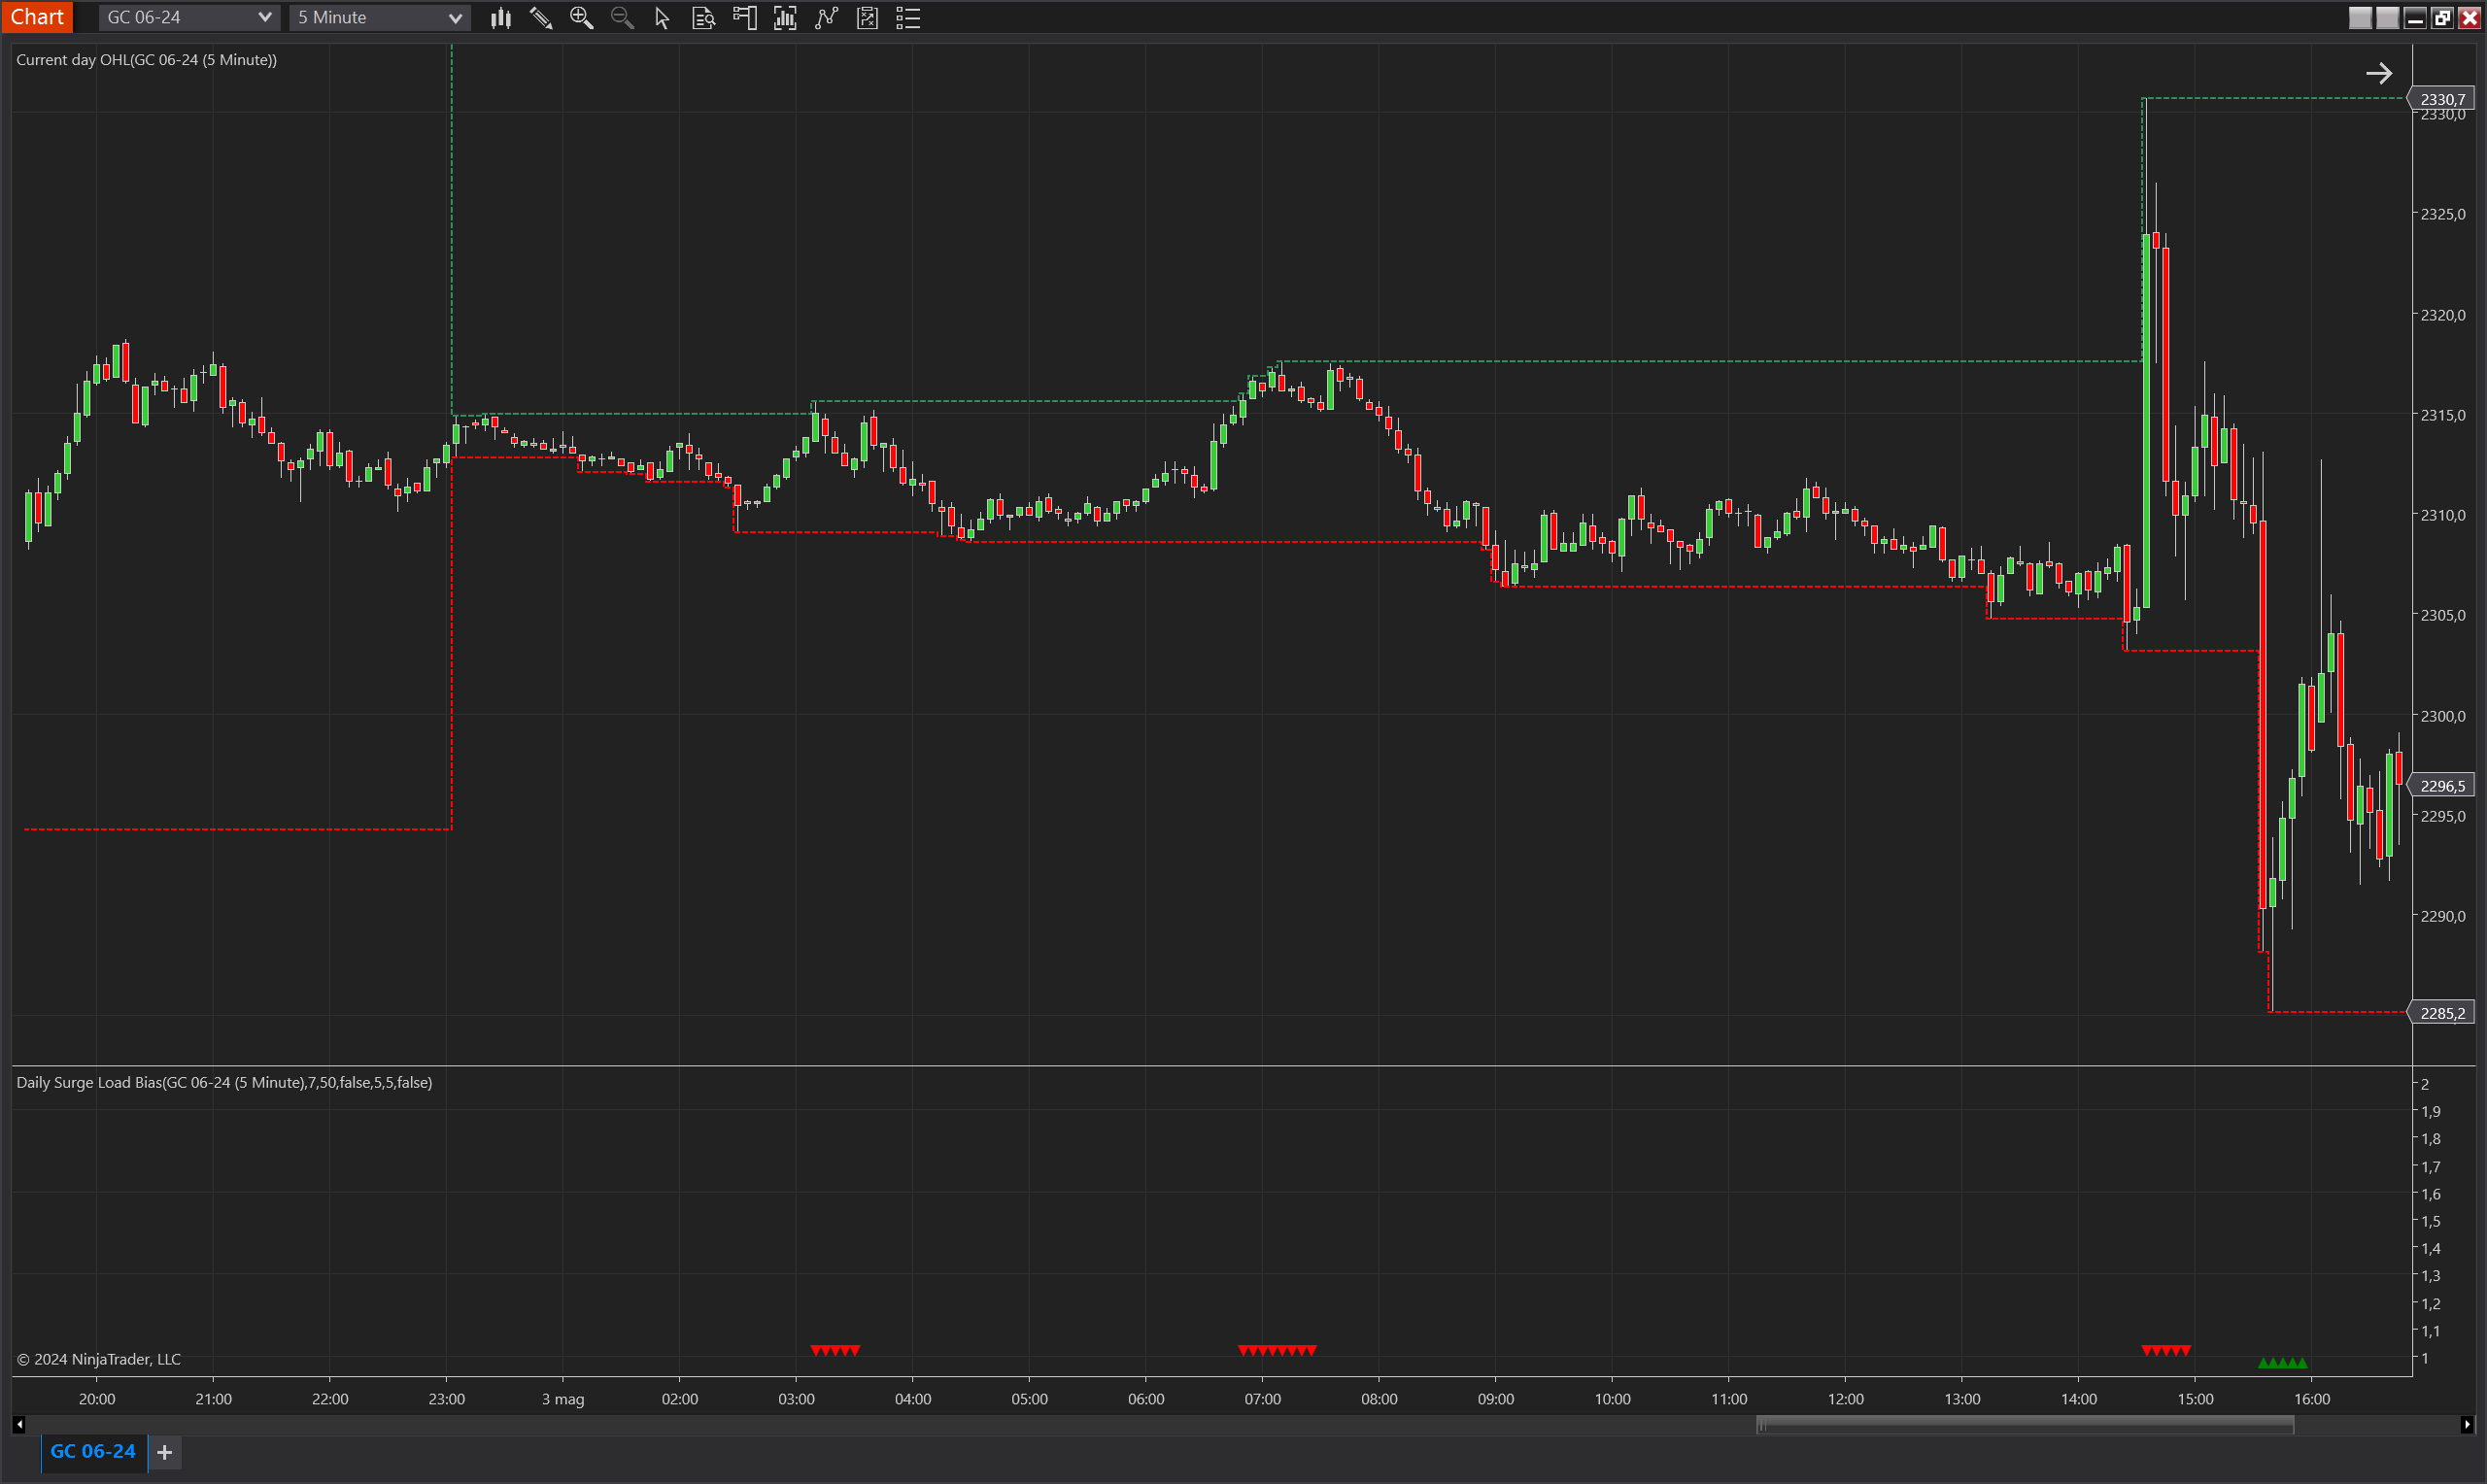
The Daily Surge Load Bias indicator identifies potential mean reversion opportunities by analyzing the current day's high and low prices. This indicator utilizes a load component that tracks the cumulative number of bars reaching new extremes, which are considered significant. A bias signal is triggered when the price rapidly approaches the opposite side of the day's range, revealing potential mean reversion biases. By combining surge momentum with cumulative extreme counting, traders can identify unique price rebound opportunities and market reversals within the daily trading session.
Key Features:
- Load Component: Keeps track of the cumulative number of bars making new extremes.
- Rapid Approach Detection: Triggers bias signals based on rapid price movement toward the day's highs or lows.
- Customizable Parameters: Offers adjustable settings like the minimum bars required, reset conditions, approach percentage, and validity period.
- Bias Inversion Capability: Allows for inverting the bias direction for flexible signal interpretation.
- Visual Confirmation: Plots distinct upward and downward triangles to visualize signals on the chart.
Tips for Implementation:
- Strategic Confirmation: Use with key support/resistance levels to confirm trades.
- Volatility Assessment: Combine with volatility measures to align signals with suitable market conditions.
- Parameter Customization: Adjust parameters to align the signals with your preferred time horizon.
- Complementary Indicators: Pair with other indicators (e.g., RSI, Bollinger Bands) for signal confirmation.
- Backtesting: Test across different market conditions to optimize settings.
Parameters
Minimum Bars for Load:
- Type: int
- Description: Minimum number of bars required to establish the load component for a bias. Can reset upon reaching the other side of the day's high/low.
- Default Value: 5
- Valid Values: Any non-negative integer
Reset on Opposite Extreme:
- Type: bool
- Description: Determines if the load component should reset when the price reaches the other extreme of the day (high or low).
- Default Value: false
- Options: true (Yes), false (No)
Approach Percentage:
- Type: double
- Description: Percentage by which the price needs to approach the day's high/low to consider a mean reversion bias.
- Default Value: 50 (50%)
- Valid Values: Any value between 0 and 100
Approach Bars:
- Type: int
- Description: The number of bars within which the price should approach the day's high/low to confirm the bias.
- Default Value: 5
- Valid Values: Any positive integer
Max Bias Validity:
- Type: int
- Description: Defines the number of bars for which the bias signal remains valid after identification.
- Default Value: 5
- Valid Values: Any positive integer greater than or equal to 1
Invert Bias Direction:
- Type: bool
- Description: Allows inverting the signal direction for trend-following or counter-trend strategies.
- Default Value: false
- Options: true (Yes), false (No)
Plots
BiasUp:
- Type: Plot
- Style: Triangle Up
- Color: Green
- Description: Marks a potential bullish mean reversion bias.
BiasDown:
- Type: Plot
- Style: Triangle Down
- Color: Red
- Description: Marks a potential bearish mean reversion bias.