Current Day Gap Threshold HL
Description
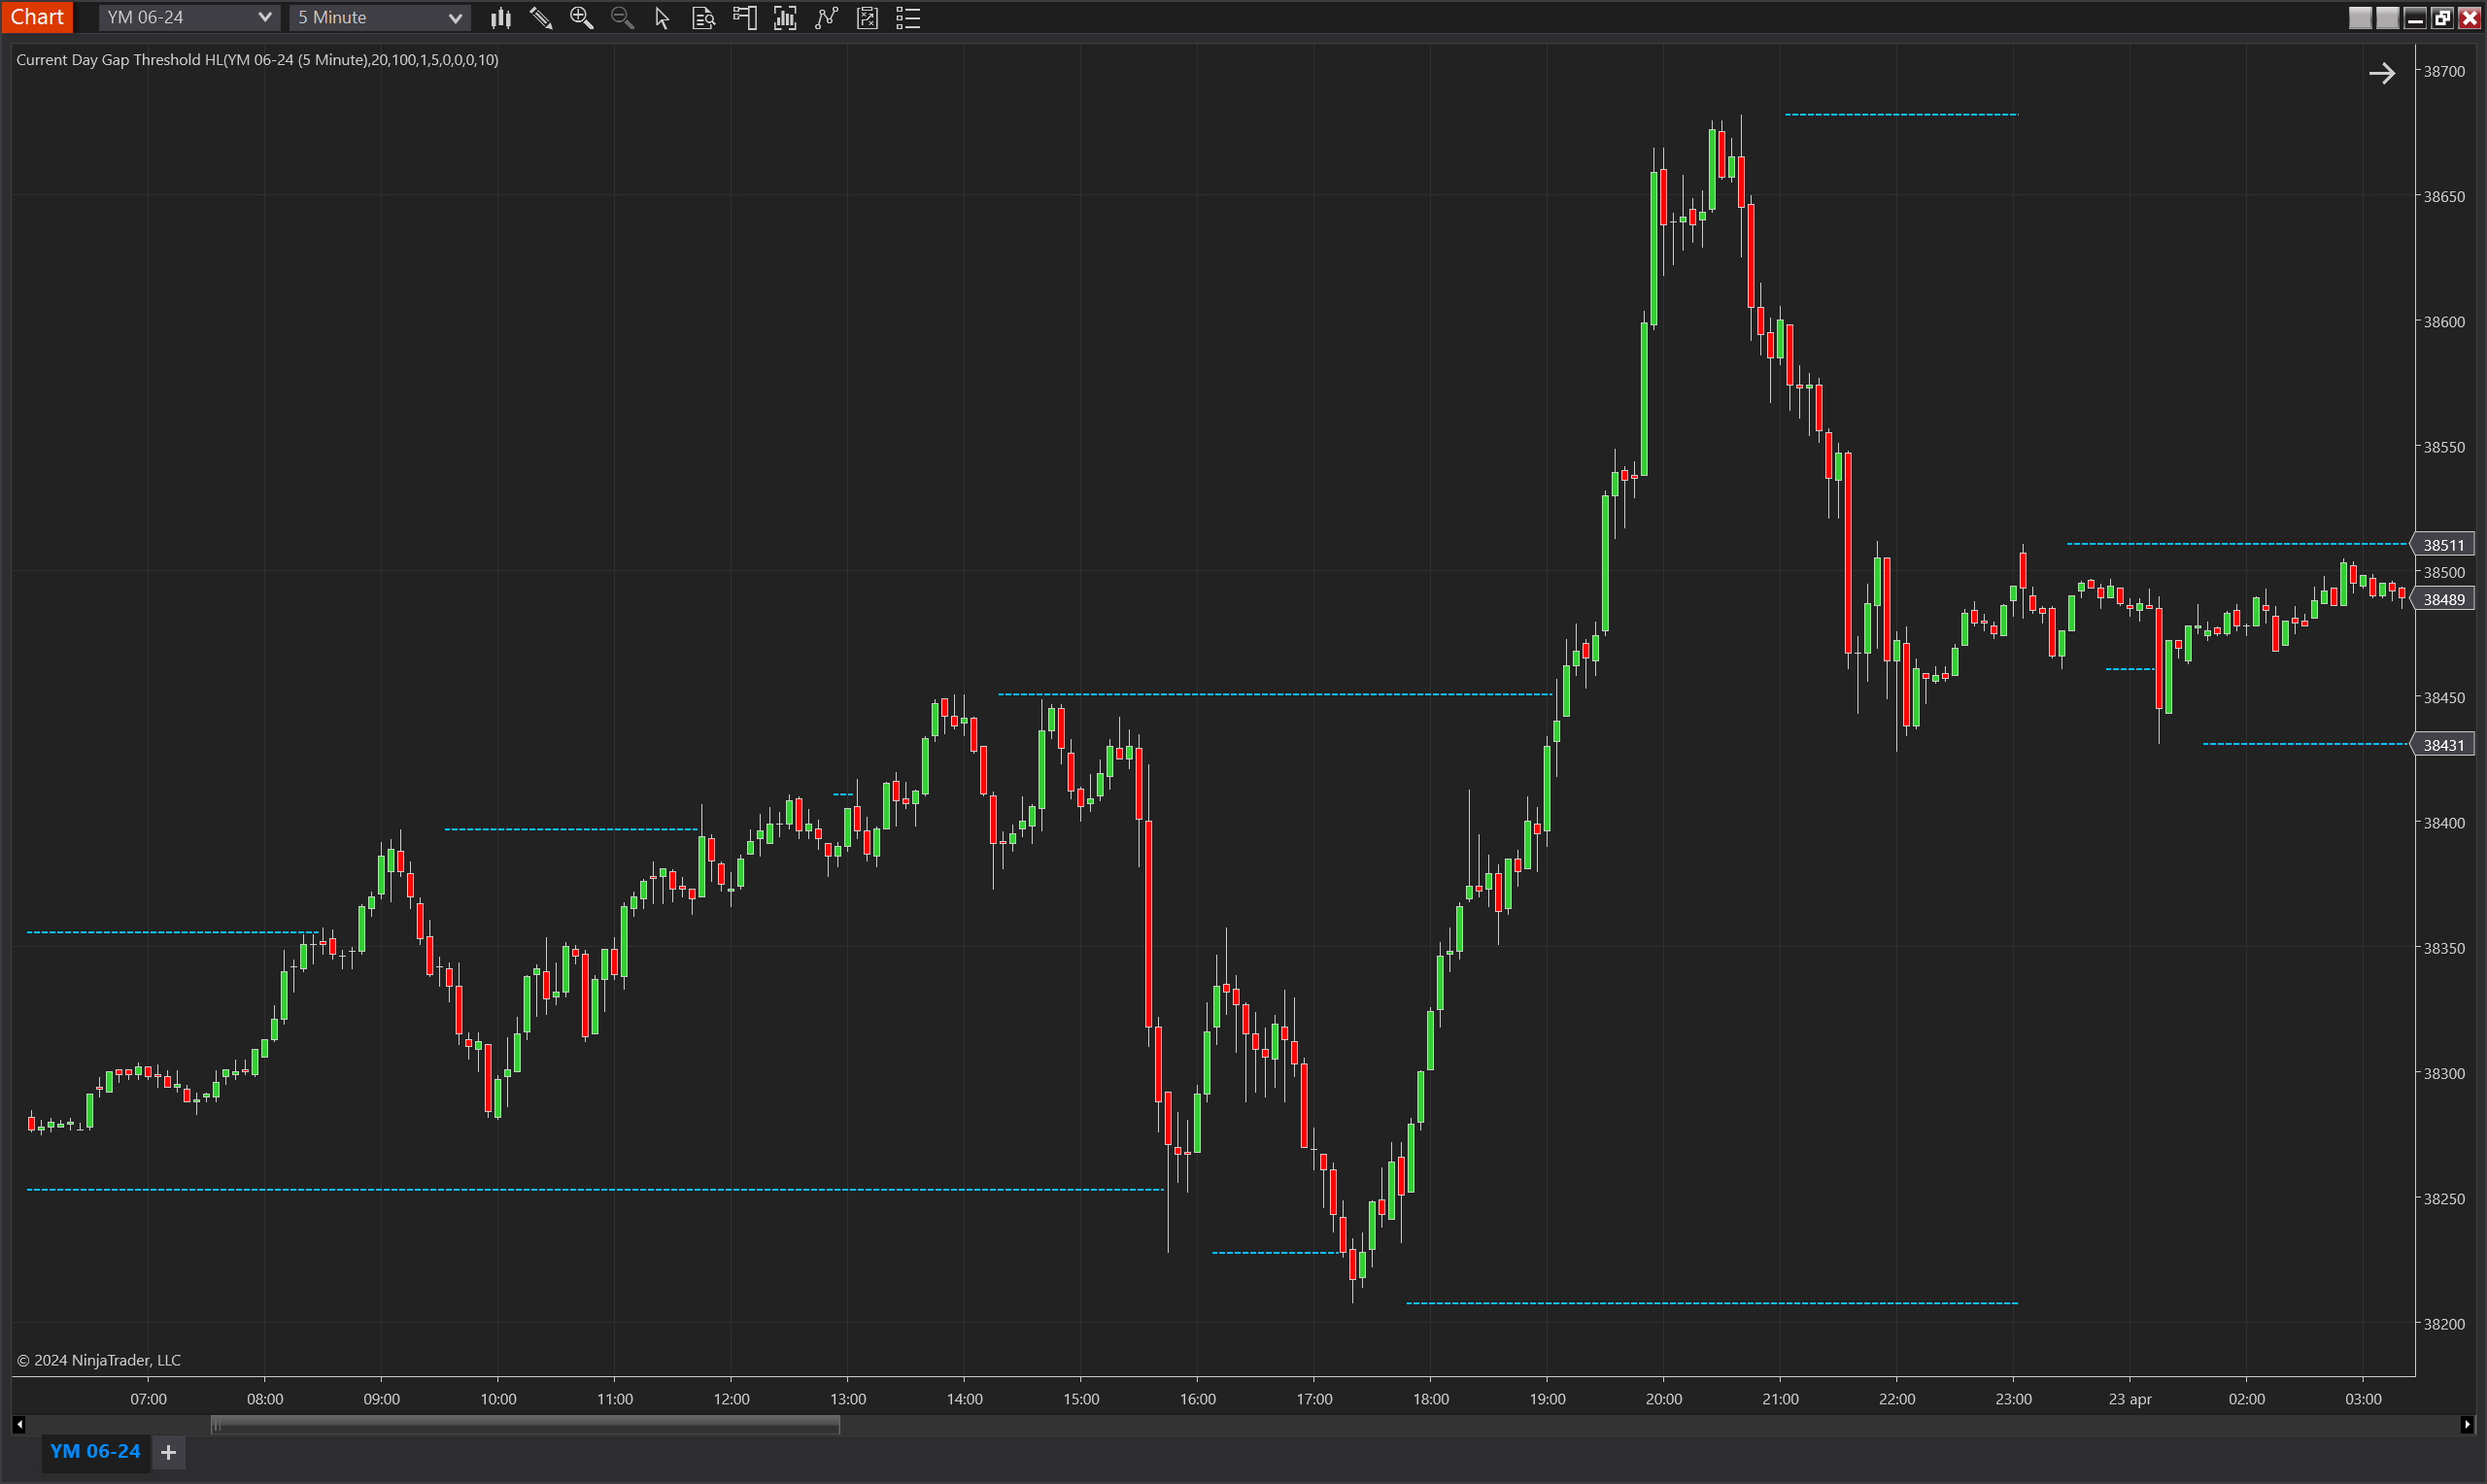
The Current Day Gap Threshold HL indicator for NinjaTrader 8 is engineered to spotlight pivotal price levels based on the current trading day's highs and lows. This innovative tool delineates these critical thresholds only when the price surpasses a specified gap distance from the ongoing price action, coupled with a minimum number of bars elapsed since the day's high or low. It’s an essential utility for traders aiming to harness the power of intra-day volatility and price momentum by identifying potential support and resistance zones that are of considerable significance.
A key facet of this indicator is its adeptness at filtering out the market noise, focusing only on the substantial movements that matter. By employing a calculated blend of gap thresholds and Average True Range (ATR) multiples, it ensures the highlighted levels are not just flukes but rather key pivot points that could dictate the course for the rest of the trading session.
Whether used as a standalone gauge or as part of a more intricate trading system, the Current Day Gap Threshold HL indicator aids traders in making more informed decisions by providing a clear-cut view of where the current day's price action stands in relation to its established range, and where it might be heading next.
Key Features
- Intraday Focus: Tailored specifically for intraday charts to provide real-time high and low thresholds of the current trading session.
- Gap Threshold Activation: Uses price gaps from the current highs and lows to activate threshold levels, ensuring only significant price movements are highlighted.
- Session-Based Calculation: Resets and recalculates high and low thresholds based on each new trading session, keeping the analysis pertinent to daily market dynamics.
- Support and Resistance Identification: Helps in pinpointing potential support and resistance areas by tracking the current day's price extremes.
- ATR and Donchian Channel Integration: Incorporates ATR for volatility measurement and Donchian Channels for range identification, enhancing the indicator's reliability.
- Customizable Sensitivity: Provides adjustable parameters to set the sensitivity of the high and low thresholds, catering to different trading styles and market conditions.
Tips for Implementation
- Combine with Price Action: Use in conjunction with candlestick patterns or price action strategies to confirm the strength and potential reversal points at the threshold levels.
- Integrate with Volume Analysis: Correlate the threshold breaches with spikes in volume to validate breakout or breakdown moves.
- Use as Entry/Exit Points: Consider the threshold levels as potential entry or exit points, but always in harmony with your overall trading strategy.
- Adjust Parameters for Market Conditions: Fine-tune the minimum number of bars and the ATR multiple according to the volatility and liquidity of the trading instrument for optimal results.
- Incorporate into Breakout Strategies: Implement the indicator within breakout strategies to determine precise levels where price is likely to experience increased momentum.
- Backtesting Is Key: Always backtest the indicator with historical data to ensure its effectiveness and to fine-tune its settings before applying it in live trading scenarios.
Parameters
Min Bars Since HL
- Type: int
- Description: The minimum number of bars that must elapse since the last recorded high or low to consider activating a new threshold level.
- Default Value: 5
- Valid Values: Any positive integer greater than or equal to 1
Min FVGs Since HL
- Type: int
- Description: Specifies the minimum number of Fair Value Gaps (FVGs) that must occur since the last high or low to activate a threshold level.
- Default Value: 0
- Valid Values: Any non-negative integer
Min Ticks
- Type: int
- Description: The minimum tick movement required from the high or low to establish a threshold level.
- Default Value: 10
- Valid Values: Any non-negative integer
Min ATR Multiple
- Type: int
- Description: A multiplier of the Average True Range (ATR) used to set the significance of the gap from the high or low threshold.
- Default Value: 1
- Valid Values: Any non-negative integer
Min Range Percent
- Type: int
- Description: The minimum percentage of the Donchian Channel's range required to activate a threshold level.
- Default Value: 0
- Valid Values: Any non-negative integer
Min Current Day Range Percent
- Type: int
- Description: The percentage of the current day's range that the price must exceed to activate a high or low threshold.
- Default Value: 0
- Valid Values: Any non-negative integer
ATR Period
- Type: int
- Description: The period over which the ATR is calculated, affecting the ATR Multiple calculation.
- Default Value: 20
- Valid Values: Any positive integer greater than or equal to 1
DC Period
- Type: int
- Description: The number of bars used for calculating the Donchian Channel, which is part of the threshold activation criteria.
- Default Value: 100
- Valid Values: Any positive integer greater than or equal to 1
Plots
Upper
- Type: Plot
- Style: Square
- Color: DeepSkyBlue
- Description: Represents the current trading day's activated high threshold level. It appears on the chart when the price and other conditions exceed the specified gap from the high of the day.
Lower
- Type: Plot
- Style: Square
- Color: DeepSkyBlue
- Description: Denotes the current trading day's activated low threshold level. It is plotted when the price and additional parameters surpass the specified gap from the low of the day.