Value Area Crossover
Description
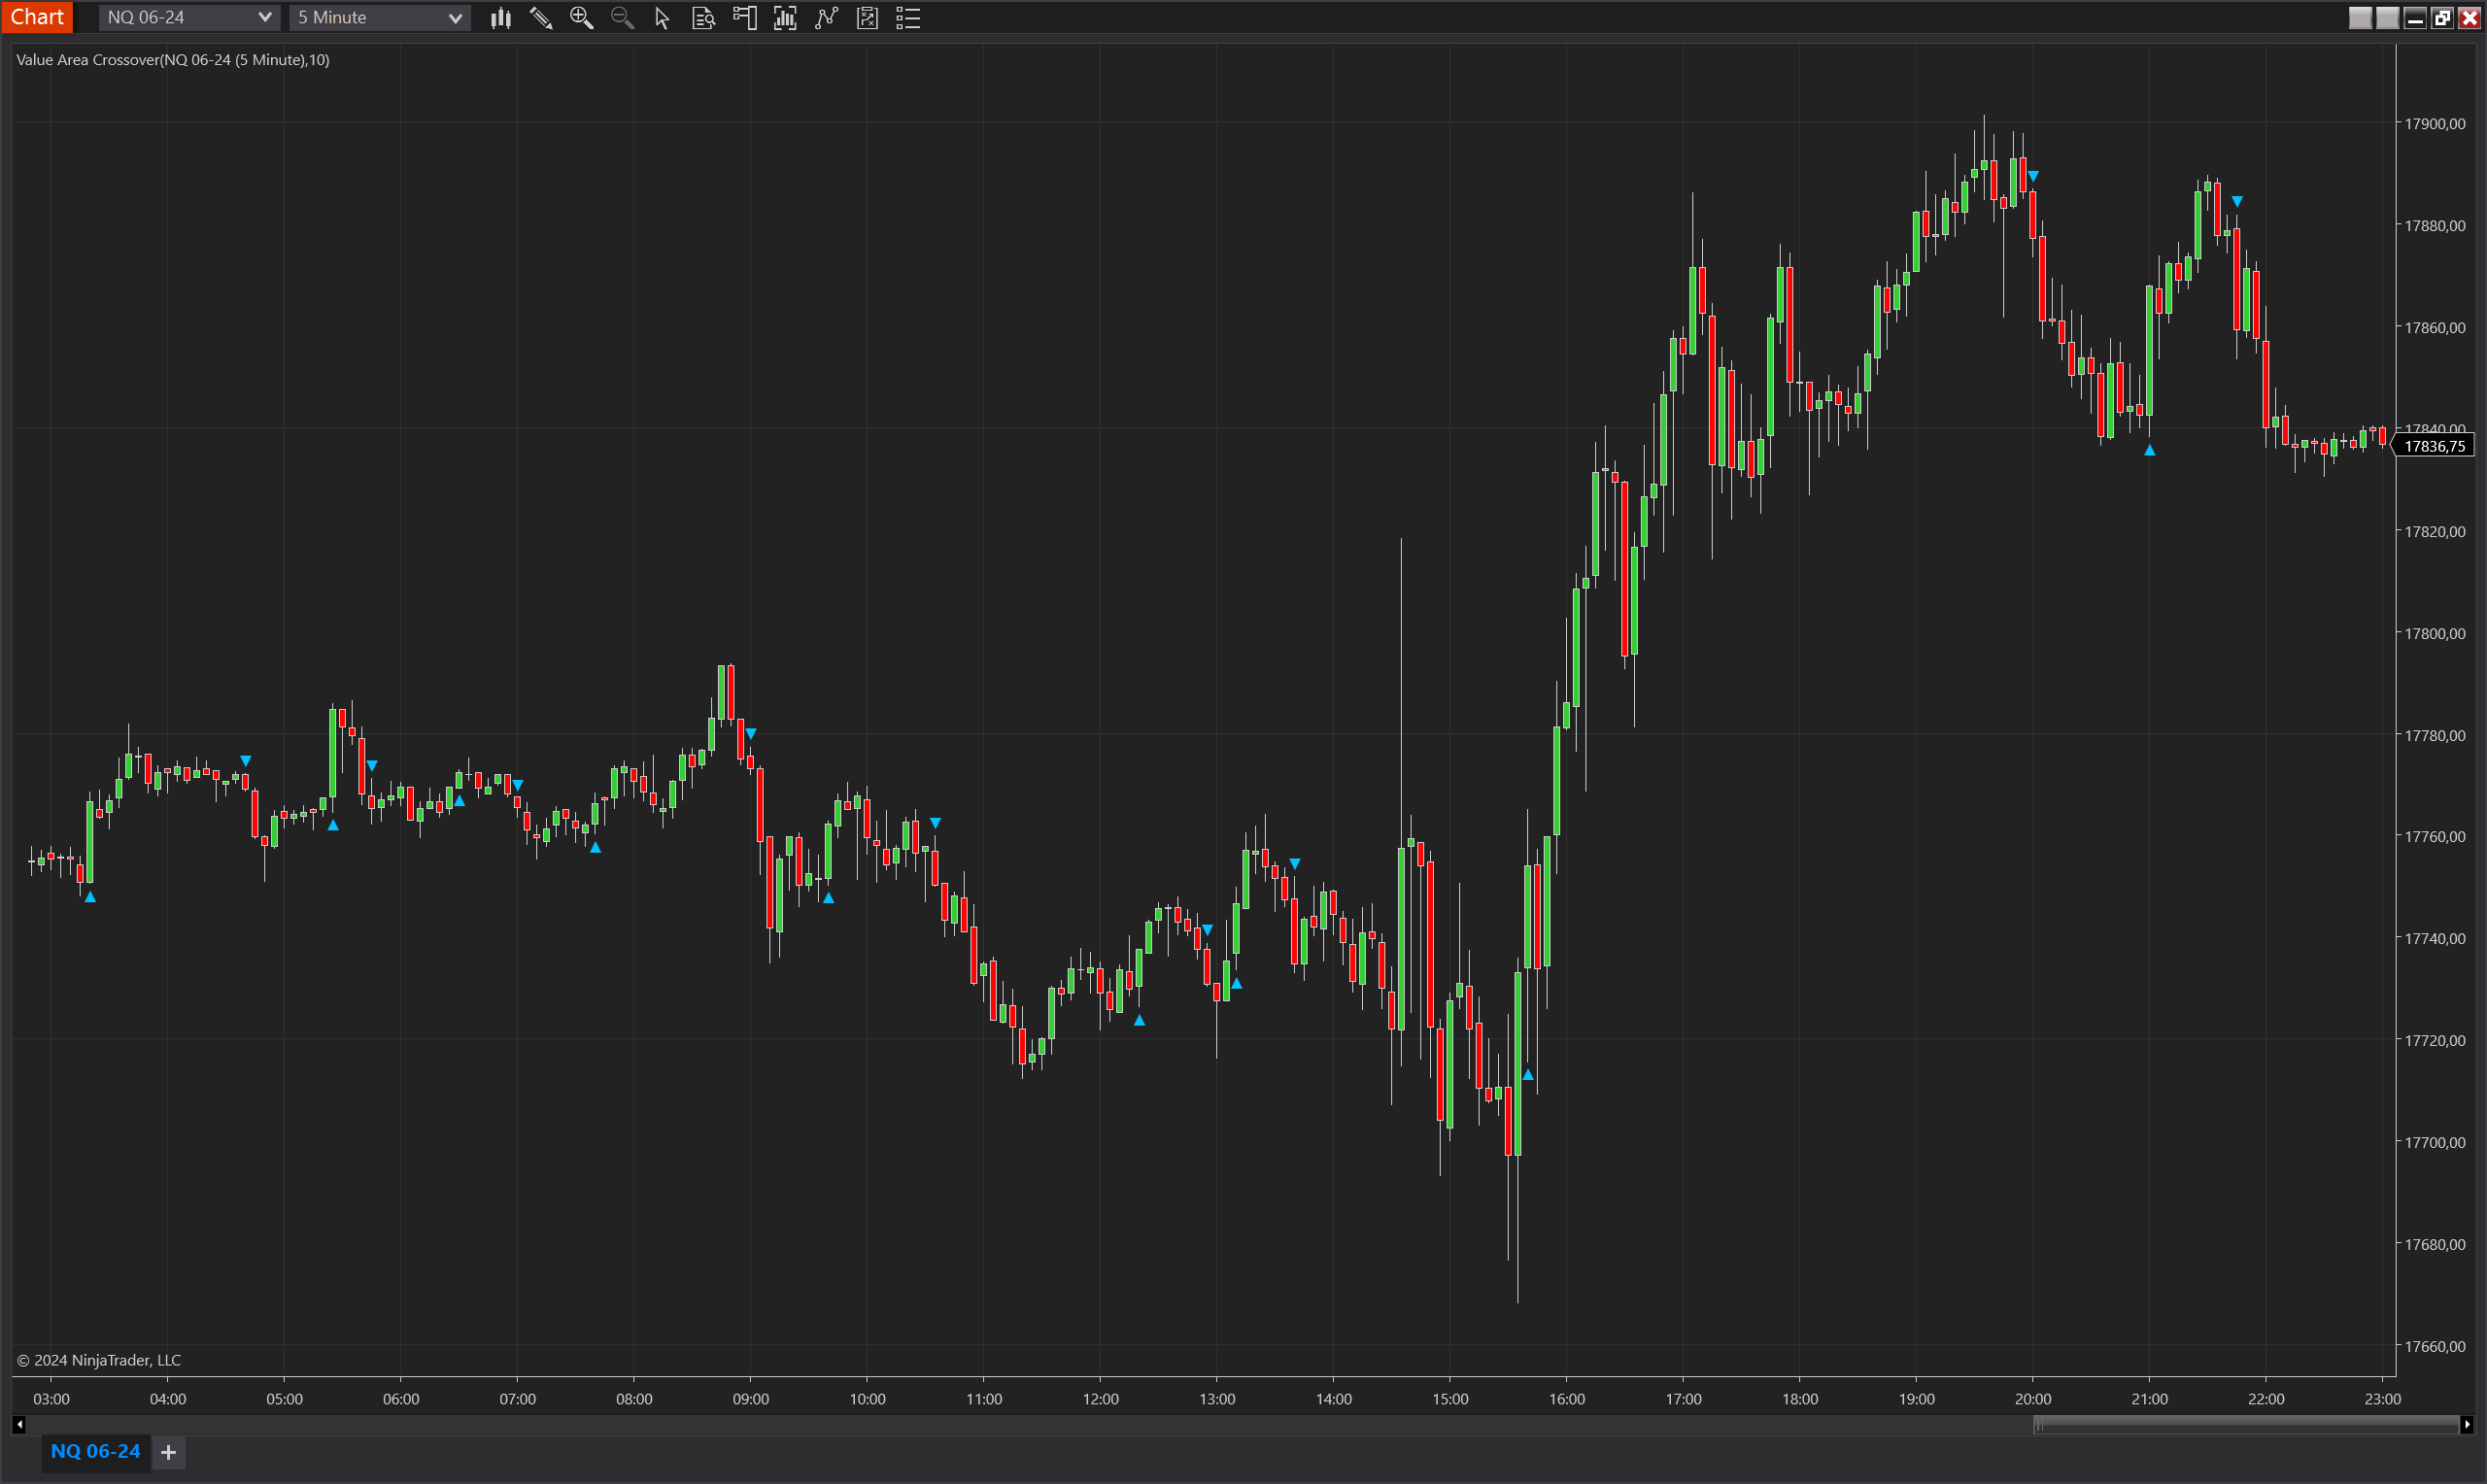
The Value Area Crossover indicator utilizes volume profile techniques to identify significant price movements as they cross over established value areas. This indicator is particularly useful for traders looking to capture momentum as prices break out of high-volume regions, suggesting a potential shift in market sentiment or trend.
Key Features
- Value Area Detection: Leverages volume profile data to define value areas where the majority of trading activity has occurred over a specified period.
- Crossover Signals: Generates signals when the price crosses above the value area high (bullish) or below the value area low (bearish), indicating potential breakout scenarios.
- Dynamic Adjustment: Adapts to changing market conditions by recalculating value areas at the end of each period, keeping the signals relevant to current price action.
Tips for Implementation
- Optimize Period Settings: Adjust the Period parameter to match the timeframe and volatility of the market you are trading. Smaller periods may be more responsive, while larger periods may provide stronger levels of support and resistance.
- Combination with Other Indicators: Enhance the effectiveness of the Value Area Crossover by combining it with trend indicators (like moving averages) or oscillators (like RSI or MACD) to confirm trend direction and strength.
- Entry and Exit Strategy: Use crossover signals to initiate trades. Consider entering a long position when the price crosses above the value area high or a short position when it crosses below the value area low. Set stop losses just outside the value area to minimize risk.
- Backtesting: Thoroughly backtest the indicator against historical data to understand its performance across different market conditions and to refine the parameters for optimal results.
By focusing on price movements relative to key volume zones, the Value Area Crossover indicator helps traders identify and capitalize on potential breakouts or reversals, offering a strategic advantage in fast-moving markets.
Parameters
Period
- Type: Integer
- Description: Defines the number of bars used to calculate the volume profile. Increasing the period lengthens the time frame considered for the value area, potentially making it more stable and significant.
- Range: 1 to infinity
- Default Value: 10 (modifiable based on user preference and trading strategy)
Plot Offset (Ticks)
- Type: Integer
- Description: Determines the number of ticks away from the high or low of the bar where signals are plotted. This offset helps in visually separating the indicator's signals from the price action, avoiding overlap and improving clarity.
- Range: 1 to infinity
- Default Value: 5 ticks
Plots
IndicatorSignalUp
- Type: Plot
- Style: Triangle Up
- Color: DeepSkyBlue
- Description: This plot appears below the price bar that closes above the value area high, signaling a bullish breakout. The plot's position is adjusted based on the 'Plot Offset' to enhance visibility on the chart.
IndicatorSignalDown
- Type: Plot
- Style: Triangle Down
- Color: DeepSkyBlue
- Description: This plot is positioned above the price bar that closes below the value area low, signaling a bearish breakdown. Similar to the bullish signal, its location is adjusted by the 'Plot Offset' parameter to ensure it does not obscure the price bars.