Alternating Body Color
Description
The Alternating Body Color indicator is a simple yet powerful price action tool designed to identify transitions in bar closures, highlighting potential shifts or continuations in market trends. By evaluating consecutive bar closures for alternating patterns, it generates frequent signals, making it ideal for testing additional filters or directional biases.
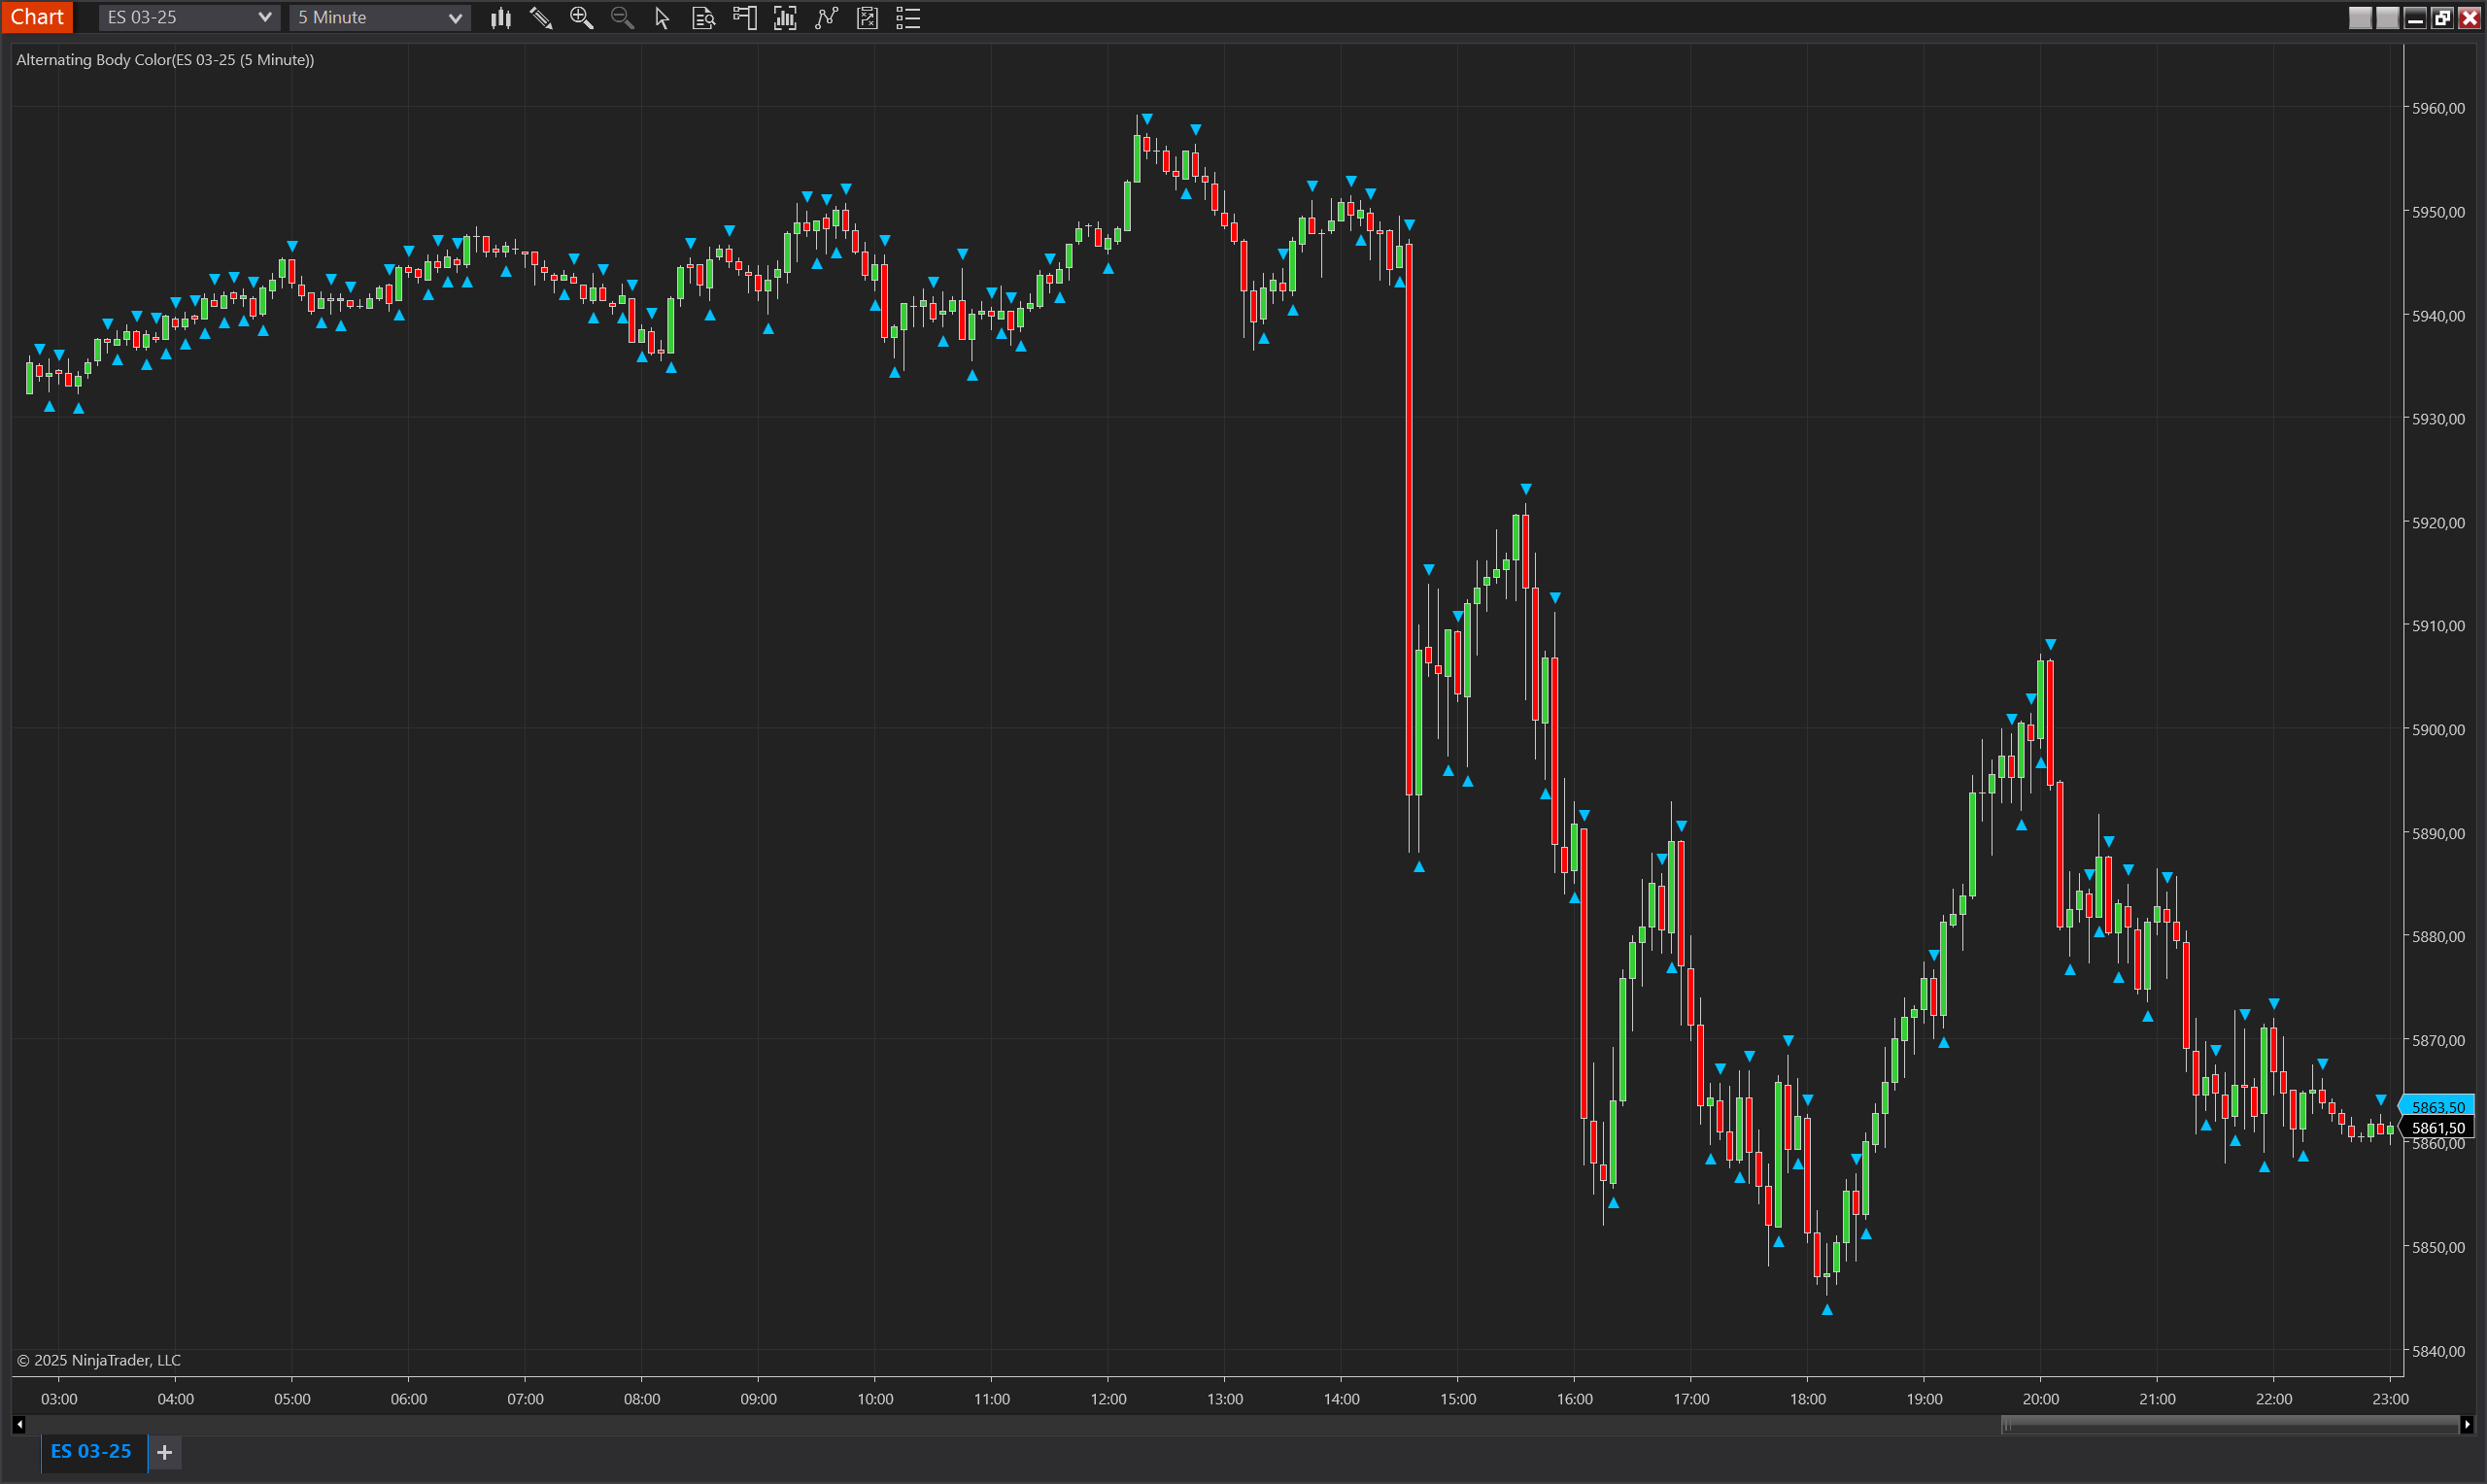
This indicator is overlay-based, plotting upward or downward triangles directly on the price chart to mark detected patterns. Its simplicity and high signal frequency make it an excellent choice for refining and testing other trading strategies or biases.
Key Features:
- Simple Price Action Detection: Focuses solely on alternating bar closures, providing a straightforward method to analyze price movements.
- High Signal Frequency: Generates frequent signals, making it great for testing additional filters, biases, or conditions within a strategy.
- Visual Signal Markers: Plots upward and downward triangles above or below bars to indicate the direction of detected patterns.
- Confirmation Candle Option: Allows traders to require an additional candle of the same color before confirming a signal.
- Overlay Indicator: Displays signals directly on the price panel for immediate visual interpretation.
Tips for Implementation:
- Great for Filter Testing: Use the indicator to test additional strategy filters or directional biases, leveraging its high signal frequency for robust testing.
- Combine with Trend Tools: Pair with indicators like Moving Averages, RSI, or Bollinger Bands to confirm the validity of signals.
- Short-Term Trend Analysis: Apply on lower timeframes for intraday trading, detecting rapid shifts in momentum or direction.
- Backtesting: Use the indicator in strategy backtests to analyze how its frequent signals perform when combined with other conditions.
Parameters
PlotOffset
- Type: int
- Description: Defines the vertical distance (in ticks) between the plotted signal and the high/low point of the bar.
- Default Value: 3
- Valid Values: Any integer greater than or equal to 1
Confirmation
- Type: bool
- Description: If set to true, the indicator requires an additional candle of the same color before confirming the signal, reducing false positives.
- Default Value: true
- Valid Values: true (Enable confirmation), false (Disable confirmation)
Plots
IndicatorSignalUp
- Type: Plot
- Style: Triangle Up
- Color: DeepSkyBlue
- Description: Indicates a detected upward price pattern based on alternating bar closures.
IndicatorSignalDown
- Type: Plot
- Style: Triangle Down
- Color: DeepSkyBlue
- Description: Indicates a detected downward price pattern based on alternating bar closures.