Max Volume Pivot
Description
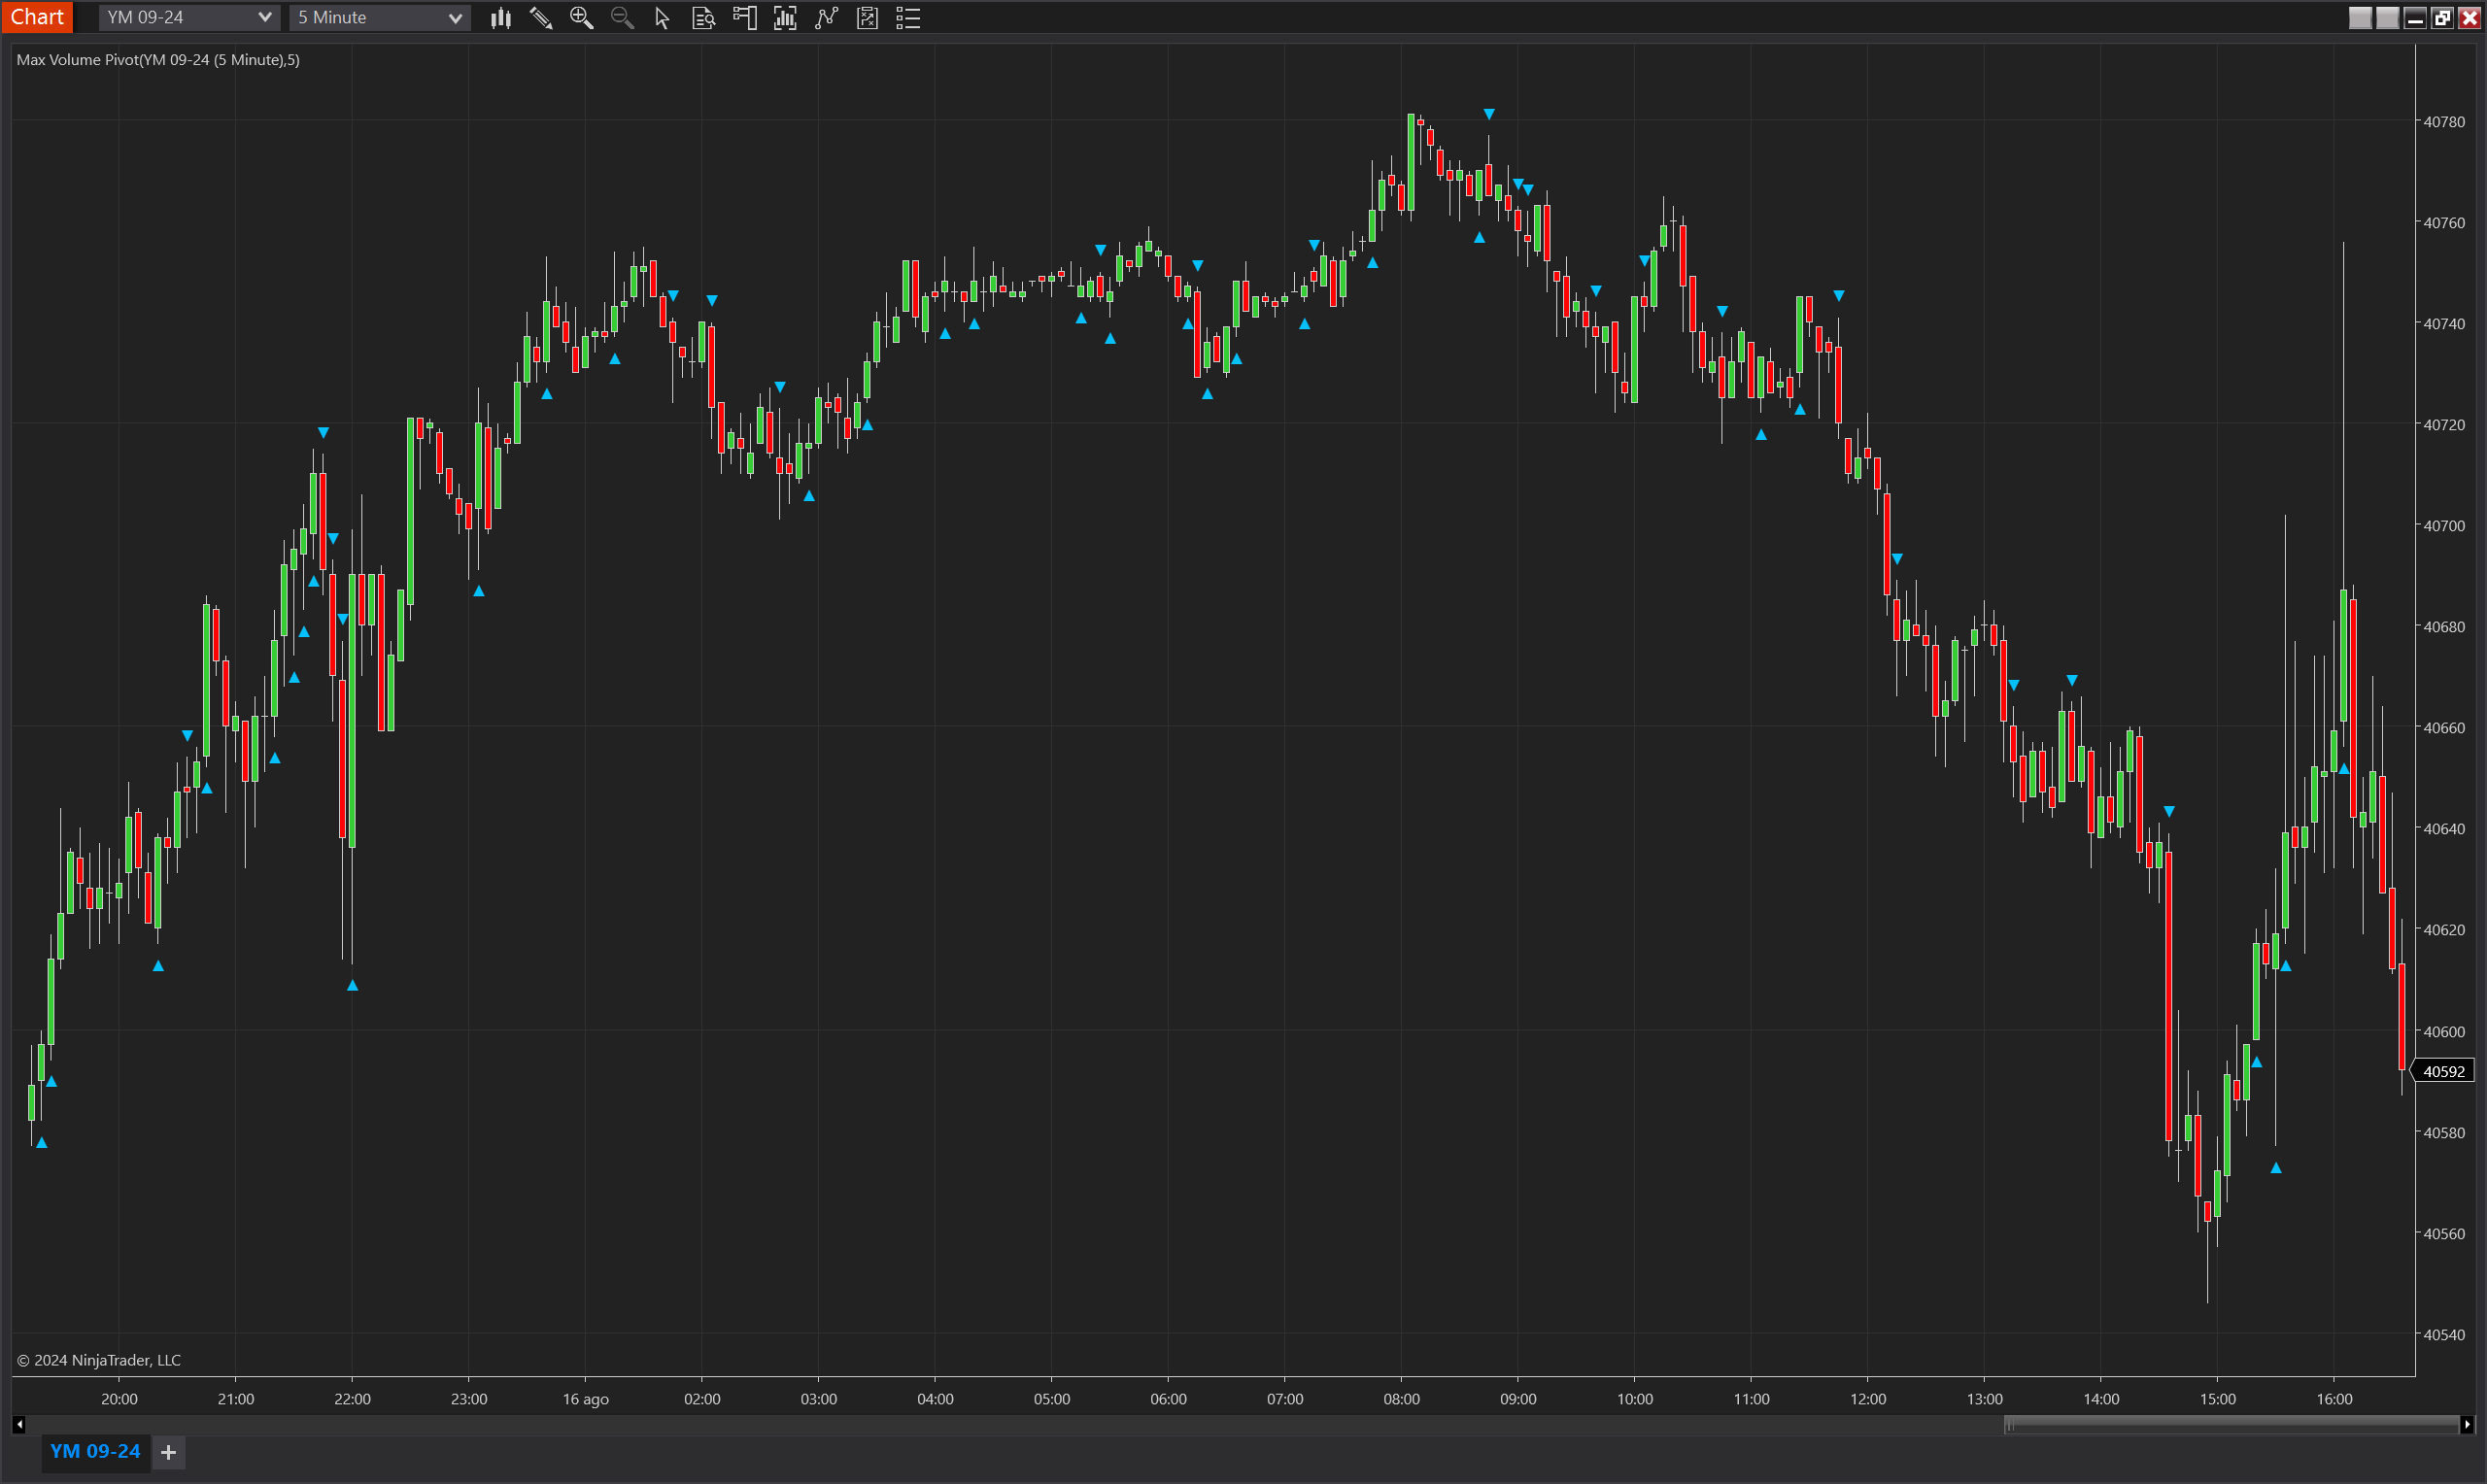
The Max Volume Pivot is a custom NinjaTrader 8 indicator designed to identify pivotal market points by detecting the highest volume within a specified period. When a bar reaches the maximum volume within the period, the indicator generates a signal: a green triangle below the bar suggests a potential long position, while a red triangle above the bar indicates a potential short position. This tool is ideal for traders looking to capitalize on high-volume reversals or continuations, making it a powerful addition to momentum and volume-based trading strategies.
This indicator is particularly effective in volatile markets where volume spikes can signal significant shifts in market sentiment. By focusing on the bars with the highest volume, traders can better pinpoint potential entry and exit points that align with the market's underlying strength or weakness.
Key Features:
- Volume-Based Signals: Identifies pivotal points in the market based on the highest volume observed over a specified period, providing traders with clear entry and exit signals.
- Directional Bias: Differentiates between bullish and bearish signals based on the closing price relative to the opening price, making it easier to identify potential trend reversals or continuations.
- Customizable Period: The user can adjust the period over which the maximum volume is calculated, allowing the indicator to be tailored to different trading styles and timeframes.
- Visual Signal Plotting: Plots distinct upward and downward triangles on the chart to visually indicate potential long and short opportunities.
Tips for Implementation:
- Trade Confirmation: Use the Max Volume Pivot signals in conjunction with other technical indicators, such as moving averages or RSI, to confirm the strength of the signal before entering a trade.
- Adjusting the Period: Customize the Period parameter to suit the specific timeframe you are trading. Shorter periods may be more effective in fast-moving markets, while longer periods can help filter out noise in more stable conditions.
- Volatility Consideration: Combine the Max Volume Pivot with a volatility indicator, such as ATR or Bollinger Bands, to ensure that signals are generated in market conditions where volume spikes are more meaningful.
- Backtesting: Perform backtesting on historical data to find the optimal Period
Parameters
Period:
- Type: int
- Description: The number of bars over which the indicator calculates the maximum volume. This period determines the timeframe in which the indicator searches for the highest volume bar to generate signals.
- Default Value: 5
- Valid Values: 2 and above
Plot Offset (Ticks):
- Type: int
- Description: Sets the distance (in ticks) between the plotted signal and the high or low of the bar, allowing for visual adjustment of the signal placement on the chart. This can be fine-tuned to improve signal clarity.
- Default Value: 3
- Valid Values: 1 and above
Plots
IndicatorSignalUp:
- Type: Plot
- Style: Triangle Up
- Color: DeepSkyBlue
- Description: Indicates a potential long position based on the highest volume bar within the specified period. This signal is plotted below the bar if the closing price is higher than the opening price.
IndicatorSignalDown:
- Type: Plot
- Style: Triangle Down
- Color: DeepSkyBlue
- Description: Indicates a potential short position based on the highest volume bar within the specified period. This signal is plotted above the bar if the closing price is lower than the opening price.