Consecutive Impulse Pullback
Description
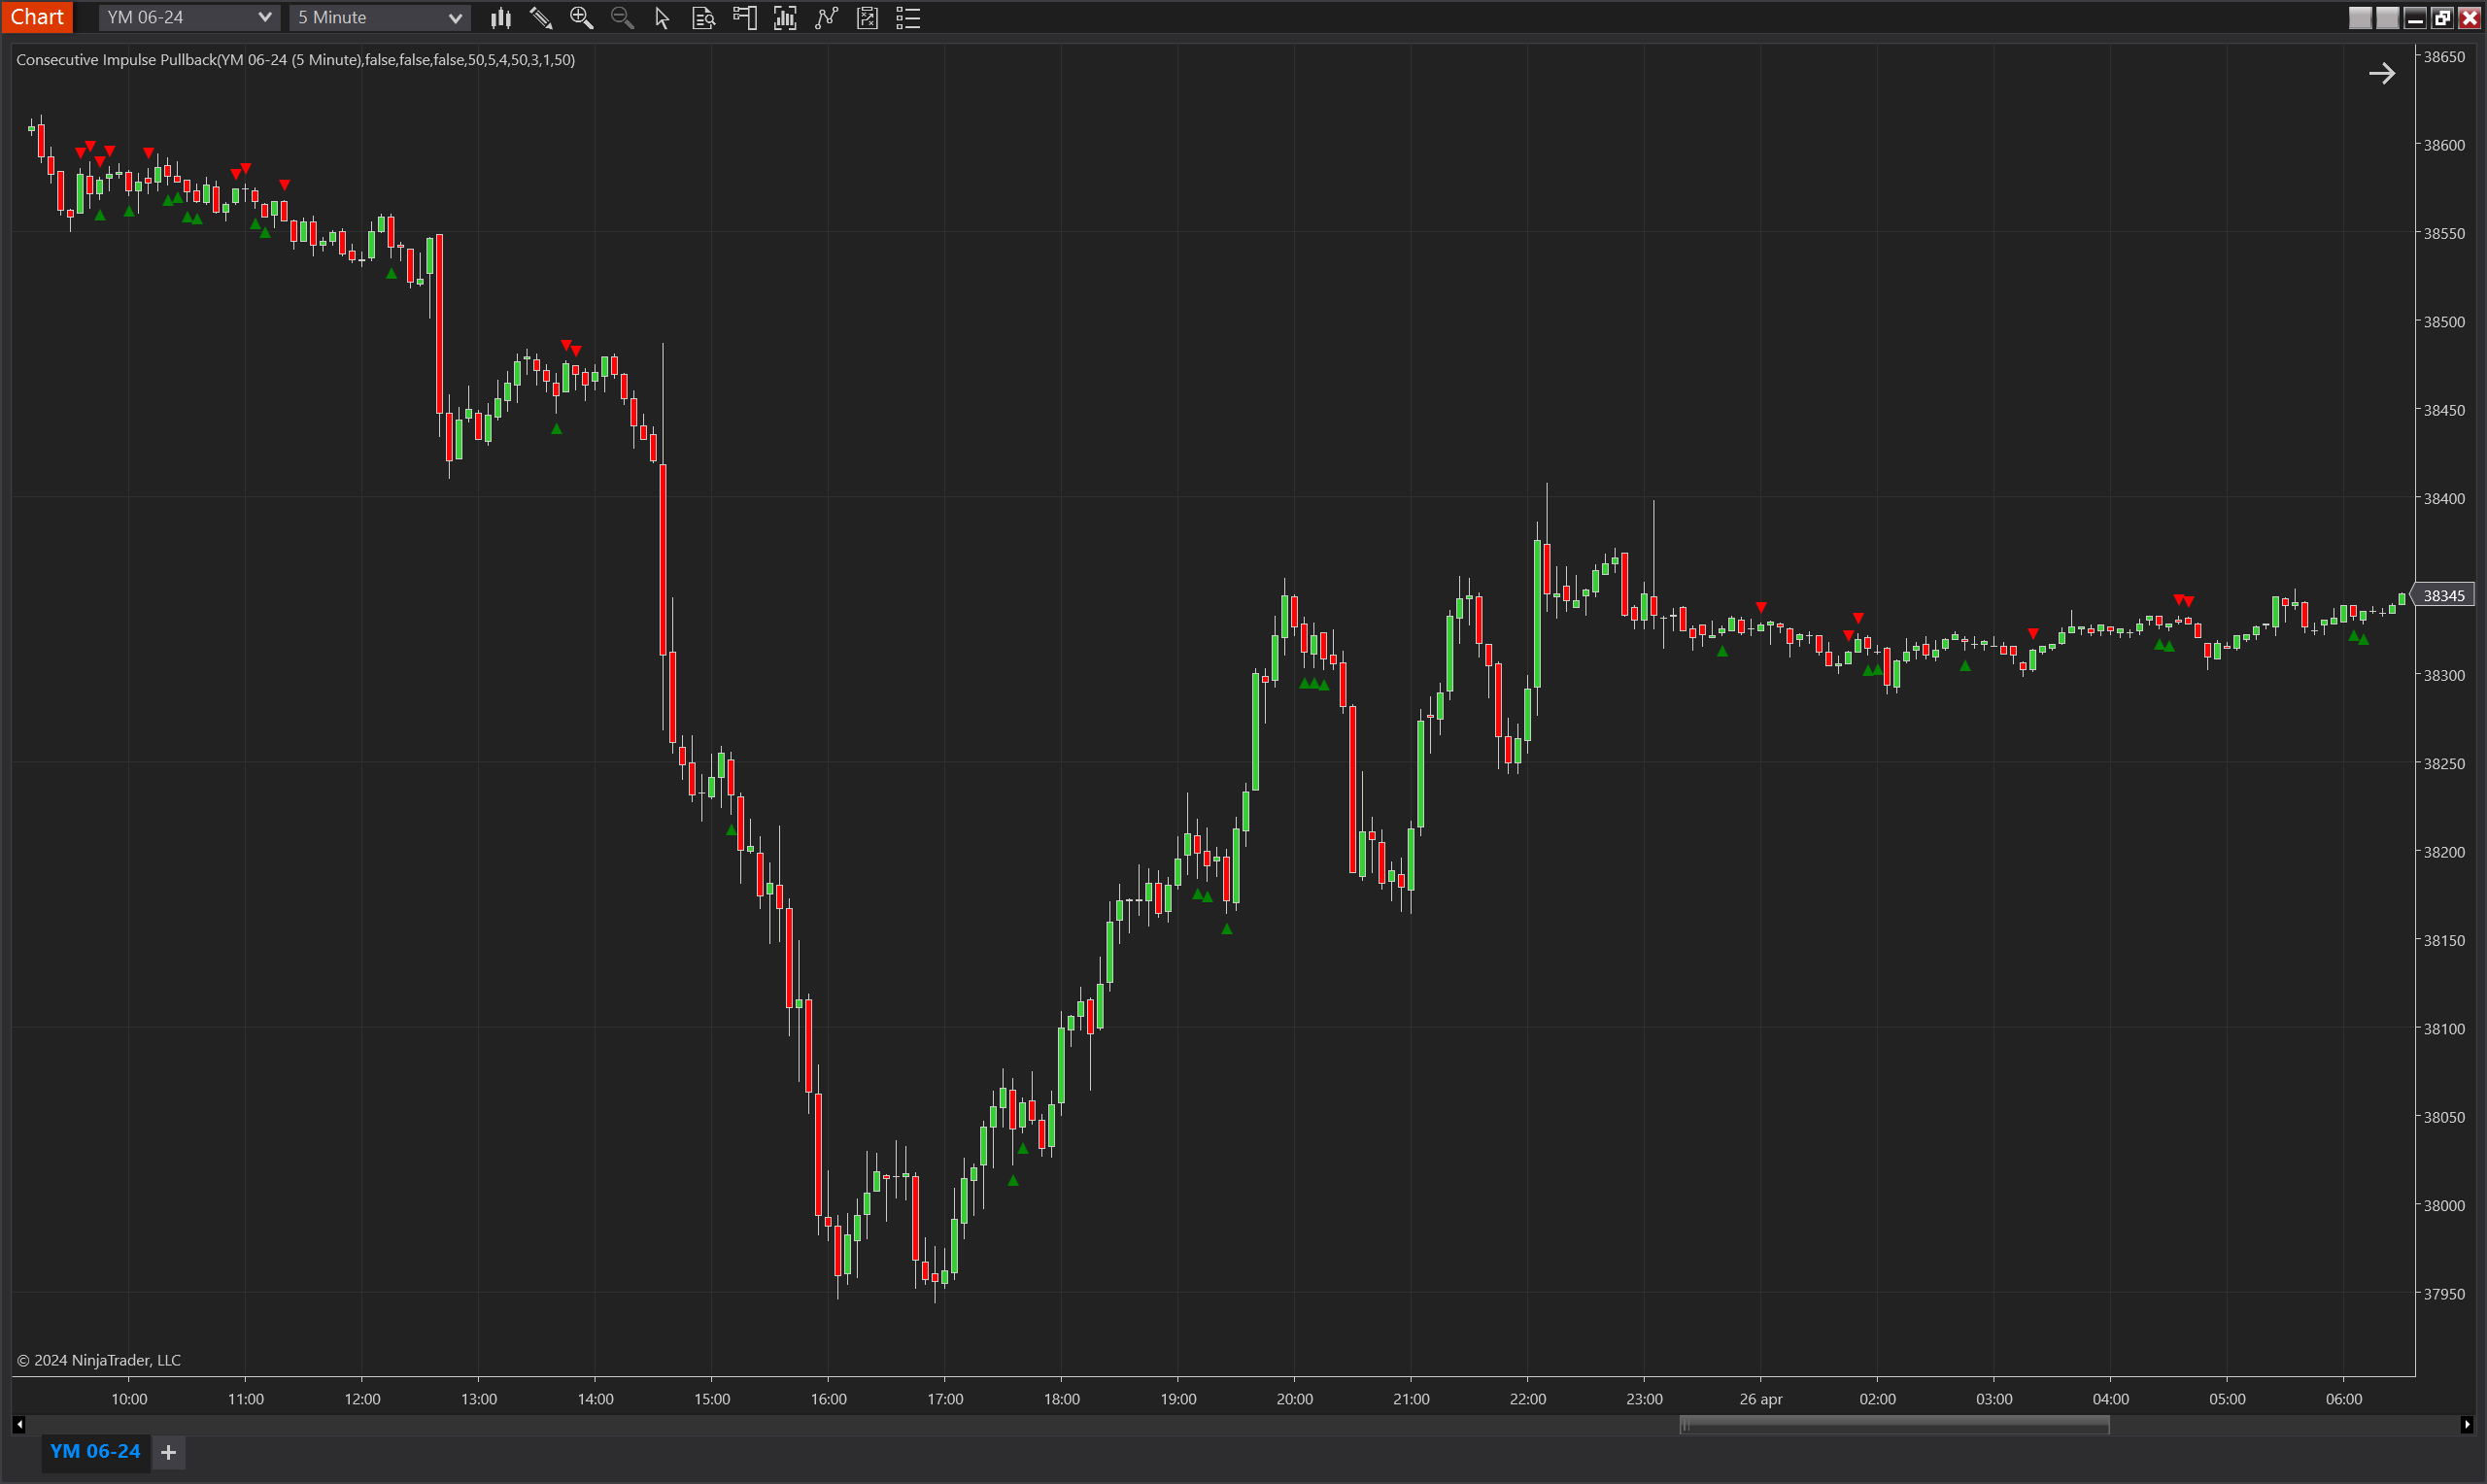
The Consecutive Impulse Pullback indicator is designed to identify a sequence of directional impulses followed by a pullback, setting up a potential breakout trade. This indicator monitors patterns of consecutive higher highs and higher lows (for bullish setups) or lower lows and lower highs (for bearish setups). Once an impulse pattern is identified, it waits for a pullback within specific parameters and then signals a breakout from the pullback phase if certain conditions are met.
Key Features
- Pattern Detection: Automatically detects sequences of consecutive higher highs and lows or lower highs and lows, facilitating trend-following strategies.
- Pullback Analysis: Tracks pullbacks after an impulse, assessing their depth and duration to pinpoint potential entry points.
- Volume Profile Integration: Optionally incorporates volume profile analysis to enhance the signal accuracy by ensuring breakouts occur with significant volume support or resistance levels.
- Dynamic Signal Validation: Signals are validated based on the continuation of the breakout direction and the absence of contradictory price action during the pullback.
Tips for Implementation
- Adjusting Parameters: Tailor the minimum and maximum bars for impulses and pullbacks to fit the typical volatility and trend characteristics of the traded asset.
- Volume Profile Usage: For more precise entries, use the volume profile settings to ensure breakouts are supported by volume concentrations (POC, VAH, VAL). This can significantly improve the reliability of the signals.
- Risk Management: Combine the indicator with stop-loss strategies that account for the volatility measured during the impulse and pullback phases. This could involve setting stops just beyond the recent impulse or pullback extremes.
- Backtesting: Thoroughly backtest the indicator across different market conditions to determine optimal settings for impulse lengths, pullback percentages, and volume profile thresholds. This helps in understanding the performance stability and potential drawdowns.
- Integration with Other Indicators: Enhance decision-making by combining this indicator with others that measure momentum, such as MACD or RSI, to confirm the strength of the breakout.
- Tick Replay Feature: If using volume profile features, ensure that the 'Tick Replay' feature is enabled to accurately reconstruct historical volume profiles, as real-time data alone might not provide sufficient detail for analysis.
By strategically implementing and adjusting the "Consecutive Impulse Pullback" indicator, traders can effectively capitalize on potential breakout opportunities following market consolidations or retracements.
Parameters
Min Impulse Bars:
- Type: Integer
- Description: Specifies the minimum number of bars required to form a valid impulse sequence.
- Default Value: 2
Max Impulse Bars:
- Type: Integer
- Description: Sets the maximum number of bars an impulse can have to qualify for analysis.
- Default Value: 10
Min Pullback Bars:
- Type: Integer
- Description: Determines the minimum number of bars required for a valid pullback after an impulse.
- Default Value: 1
Max Pullback Bars:
- Type: Integer
- Description: Defines the maximum number of bars a pullback can consist of following an impulse.
- Default Value: 4
Min Pullback Percentage:
- Type: Integer
- Description: The minimum percentage the pullback must retrace from the impulse for it to be considered valid.
- Default Value: 50
Impulse Extremes Break:
- Type: Boolean
- Description: Determines whether the price must break the extremes of the impulse phase during the pullback to validate the setup.
- Default Value: False
Entry Beyond Poc:
- Type: Boolean
- Description: Requires that the entry bar's high or low extends beyond the Point of Control (POC) for the setup to trigger.
- Default Value: False
Entry Bar Touches Poc:
- Type: Boolean
- Description: Checks if the entry bar needs to touch the Point of Control (POC) to validate the entry signal.
- Default Value: False
Min Bar Size Deviation Percent:
- Type: Integer
- Description: The minimum percentage that bar sizes should deviate from the average during the impulse or pullback phase.
- Default Value: 50
Max Bar Size Deviation Percent:
- Type: Integer
- Description: The maximum percentage that bar sizes are allowed to deviate from the average during the impulse or pullback phase.
- Default Value: 50
Plot Offset (Ticks):
- Type: Integer
- Description: Adjusts the distance between the plotted signal and the actual price bar, measured in ticks. Useful for visual clarity on the chart.
- Default Value: 5
Plots
IndicatorSignalUp:
- Type: Triangle Up
- Color: Green
- Description: Marks the potential entry point for a bullish setup where the conditions for an impulse followed by a pullback have been met.
IndicatorSignalDown:
- Type: Triangle Down
- Color: Red
- Description: Marks the potential entry point for a bearish setup where the conditions for an impulse followed by a pullback have been met.