Momentum Contrast
Description
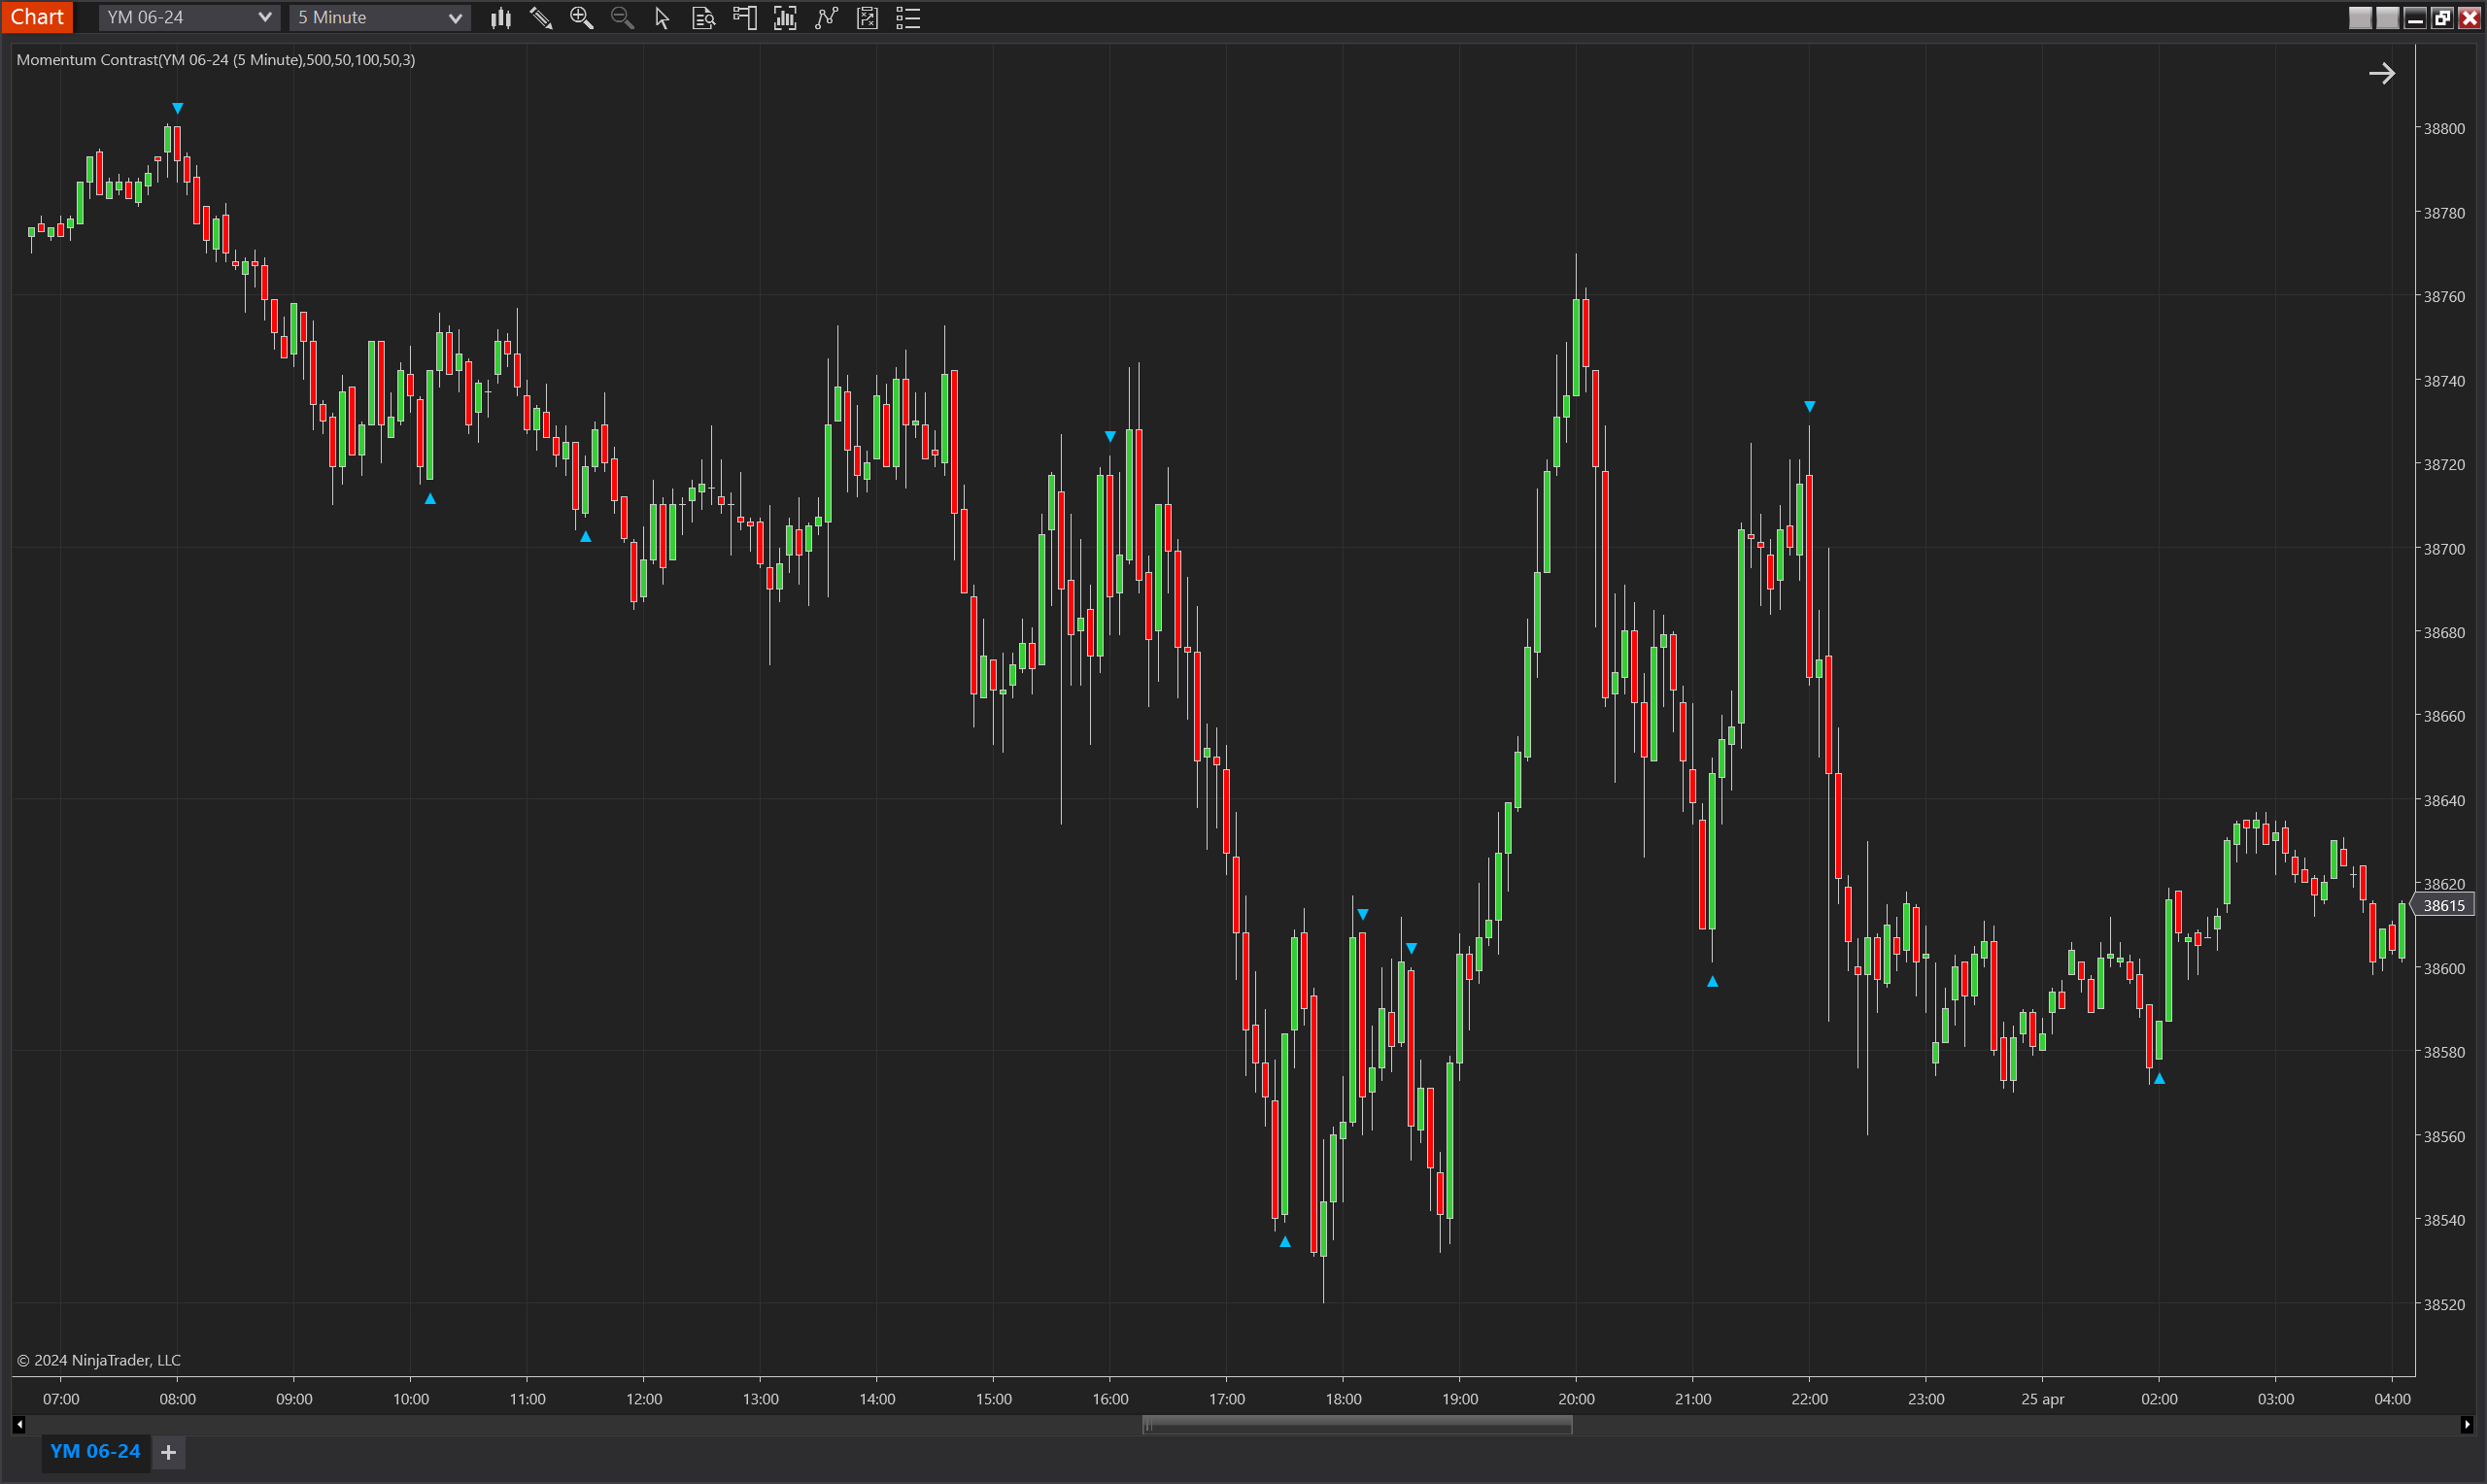
The Momentum Contrast indicator identifies dynamic price movements characterized by consecutive bars that make significantly larger bodies compared to the average, but in opposing directions. This pattern highlights potential market reversal points or significant shifts in market sentiment. It captures the essence of momentum changing from one direction to another, suggesting a possible entry point after a strong movement followed by a counter-movement.
Key Features
Dual SMA Calculation:
- Utilizes two Simple Moving Averages (SMAs) to assess the typical body range of candles:
- An SMA over a specified period to gauge the general body size over a more extended period.
- A two-bar SMA to focus on the very recent changes in candle body size, providing a quick-reacting filter to identify significant changes.
Dynamic Body Size Criteria:
- The indicator compares recent body sizes against the historical average to identify unusual activity. Bodies that are significantly larger than the previous periods’ SMA indicate potential momentum shifts.
Flexible Sensitivity:
- Users can adjust the sensitivity of what constitutes a 'significant' body size through percentage parameters, allowing for customization based on volatility and personal trading style.
Tips for Implementation
Setting Parameters:
- Adjust the Period for the SMAs based on the typical cycle length you observe in your trading instrument. Longer periods smooth out volatility, while shorter periods react faster to market changes.
- The MinBodyIncreasePercent and MaxBodyIncreasePercent can be fine-tuned to capture the most relevant movements without too much noise. Start with a default setting and adjust according to the responsiveness and accuracy you observe.
Trade Confirmation:
- Due to the nature of this indicator, it's advisable to use it in conjunction with other indicators like volume, RSI, or MACD to confirm the momentum shift and reduce the risk of false signals.
Risk Management:
- Implement strict stop-loss orders based on technical levels or a set percentage of your trading capital. Since this indicator might identify rapid market turns, timely exits are crucial to protect gains and limit losses.
Backtesting:
- Extensively backtest the indicator under various market conditions to understand its behaviour and optimize the settings for maximum effectiveness.
Visual Aids:
- Utilize the plots (IndicatorSignalUp and IndicatorSignalDown) to visually identify when the conditions for a momentum contrast are met. The visual cues can significantly enhance the speed and accuracy of your trading decisions.
Parameters
Period:
- Description: Number of bars used for calculating the primary Simple Moving Average (SMA) to evaluate the average body size over a specified period.
- Type: Integer
- Default Value: 3
- Range: 1 to ∞
Min Body Increase Percent:
- Description: Minimum percentage increase in the body size of the candle compared to the average body size (from SMA) necessary to trigger a potential signal.
- Type: Integer
- Default Value: 20
- Range: 0 to ∞
Max Body Increase Percent:
- Description: Maximum threshold for the percentage increase in body size to consider the movement valid, preventing excessively large bodies from triggering a signal.
- Type: Integer
- Default Value: 500
- Range: 1 to ∞
Min Body Size Deviation Percent:
- Description: The minimum deviation from the two-bar SMA that the body size of a candle must reach to consider it for signaling.
- Type: Integer
- Default Value: 50
- Range: 0 to ∞
Max Body Size Deviation Percent:
- Description: The maximum deviation from the two-bar SMA allowed for the body size of a candle, helping to filter out extreme anomalies.
- Type: Integer
- Default Value: 50
- Range: 0 to ∞
Plot Offset (Ticks):
- Description: The distance, in ticks, from the high or low of the bar where the signal plots will appear. This helps in visual differentiation of signals on the chart.
- Type: Integer
- Default Value: 3
- Range: 1 to ∞
Plots
IndicatorSignalUp:
- Style: Triangle Up
- Color: DeepSkyBlue
- Description: Marks the location below the low of the bar where a bullish momentum contrast signal is identified, suggesting a potential upward movement.
IndicatorSignalDown:
- Style: Triangle Down
- Color: DeepSkyBlue
- Description: Marks the location above the high of the bar where a bearish momentum contrast signal is identified, indicating a potential downward movement.