Consecutive Highs And Lows Breakout
Description
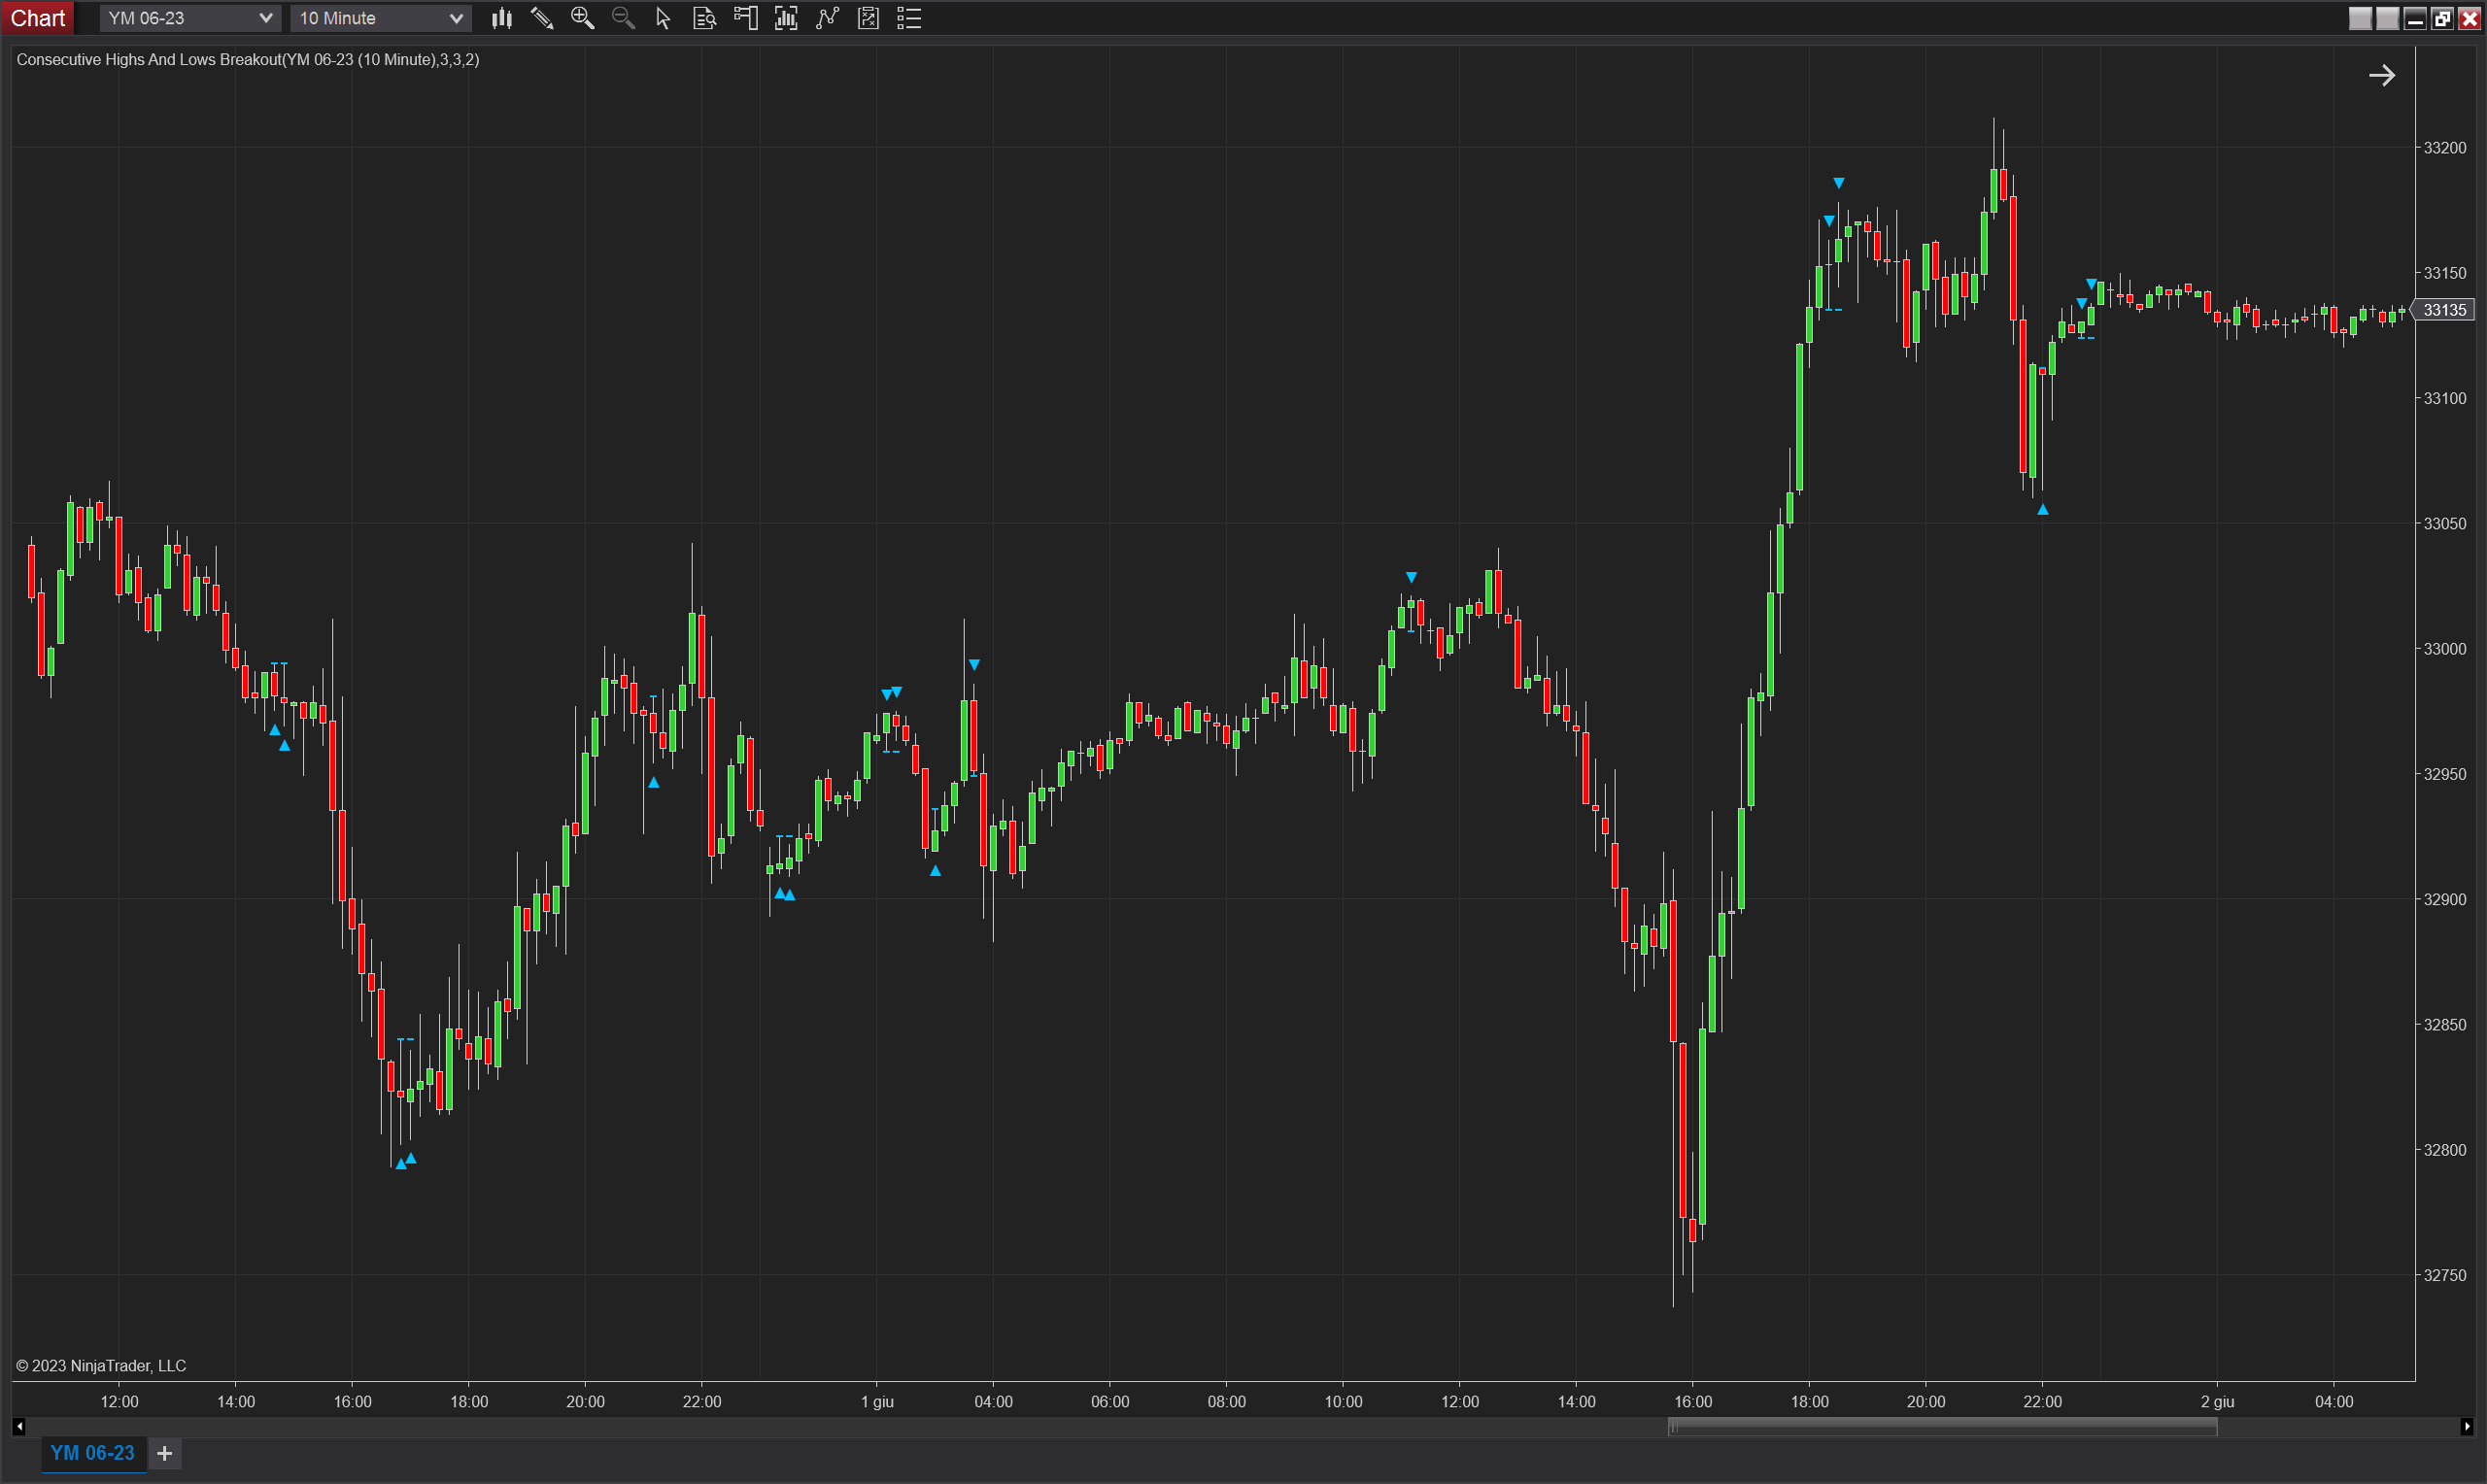
The Consecutive Highs And Lows Breakout indicator is designed to detect and signal potential breakout opportunities following a sequence of either upward or downward price movements. This indicator identifies patterns of three or more consecutive higher highs and higher lows or three consecutive lower lows and lower highs. Once these patterns are recognized, the indicator monitors for a period where these patterns do not continue, signalling a potential breakout if the price action deviates from the established pattern without forming an opposite pattern.
Key Features
- Pattern Recognition: Automatically identifies sequences of three consecutive higher highs and higher lows, or lower lows and lower highs.
- Breakout Signals: Triggers signals when there is a breakout that does not make a lower low in a downward sequence or a higher high in an upward sequence.
- Adjustable Period: Allows customization of the number of bars to consider for identifying consecutive highs and lows, providing flexibility to adapt to different market conditions or timeframes.
- Visual Signals: Utilizes upward and downward triangles to visually indicate potential breakout points on the price chart.
Tips for Implementation
- Backtesting: Before applying the indicator to live trading, backtest it against historical data to understand how it behaves with your trading instruments in different market conditions.
- Signal Confirmation: Combine this indicator with other forms of analysis (such as trend lines or oscillators) to confirm breakout signals and reduce the risk of false breakouts.
- Adjust Settings: Experiment with the Min Consecutive Bars, Period, and Signal Validity settings to find the optimal configuration that aligns with your trading strategy and the typical volatility of the assets you trade.
- Risk Management: Always use stop-loss orders to manage risks effectively, particularly in volatile markets where price movements can rapidly change direction.
Implementing this indicator involves monitoring the provided signals and adjusting the settings according to the asset's behavior and market conditions. It's particularly useful in markets where price patterns and trends are prominent and can serve as a strategic tool in a breakout trading system.
Parameters
Min Consecutive Bars
- Type: Integer
- Description: Specifies the minimum number of consecutive bars that must form higher highs and higher lows, or lower lows and lower highs to identify a valid pattern.
- Default Value: 3
- Usage: Adjust to increase or decrease the sensitivity of the pattern detection.
Period
- Type: Integer
- Description: Determines the number of bars to check for continuation or deviation from the identified consecutive pattern.
- Default Value: 3
- Usage: Can be modified to cater to different trading styles and timeframes, affecting how quickly the indicator reacts to price changes.
Signal Validity
- Type: Integer
- Description: The number of bars for which a signal remains valid after being triggered.
- Default Value: 2
- Usage: Helps in determining the persistence of a signal, allowing traders to manage entries based on the staying power of the breakout.
Plot Offset (Ticks)
- Type: Integer
- Description: Represents the distance, in ticks, between the plotted signal and the high or low point of the bar. This value helps in visualizing signals away from the exact high or low to avoid overlap on the chart.
- Default Value: 5
- Usage: Adjust to ensure that signals are clearly visible on the chart, especially in fast-moving markets.
Plots
IndicatorSignalUp
- Type: Plot
- Style: Triangle Up
- Color: DeepSkyBlue
- Description: Indicates a bullish breakout signal. It is plotted as a triangle pointing upwards at a position calculated based on the Plot Offset.
SignalUpLevel
- Type: Plot
- Style: Hash
- Color: DeepSkyBlue
- Description: Marks the level associated with the bullish breakout signal, providing a reference point for where the breakout occurred.
IndicatorSignalDown
- Type: Plot
- Style: Triangle Down
- Color: DeepSkyBlue
- Description: Indicates a bearish breakout signal. It is plotted as a triangle pointing downwards at a position calculated based on the Plot Offset.
SignalDownLevel
- Type: Plot
- Style: Hash
- Color: DeepSkyBlue
- Description: Marks the level associated with the bearish breakout signal, providing a reference point for where the breakout occurred.