Donchian Breakout Continuation
Description
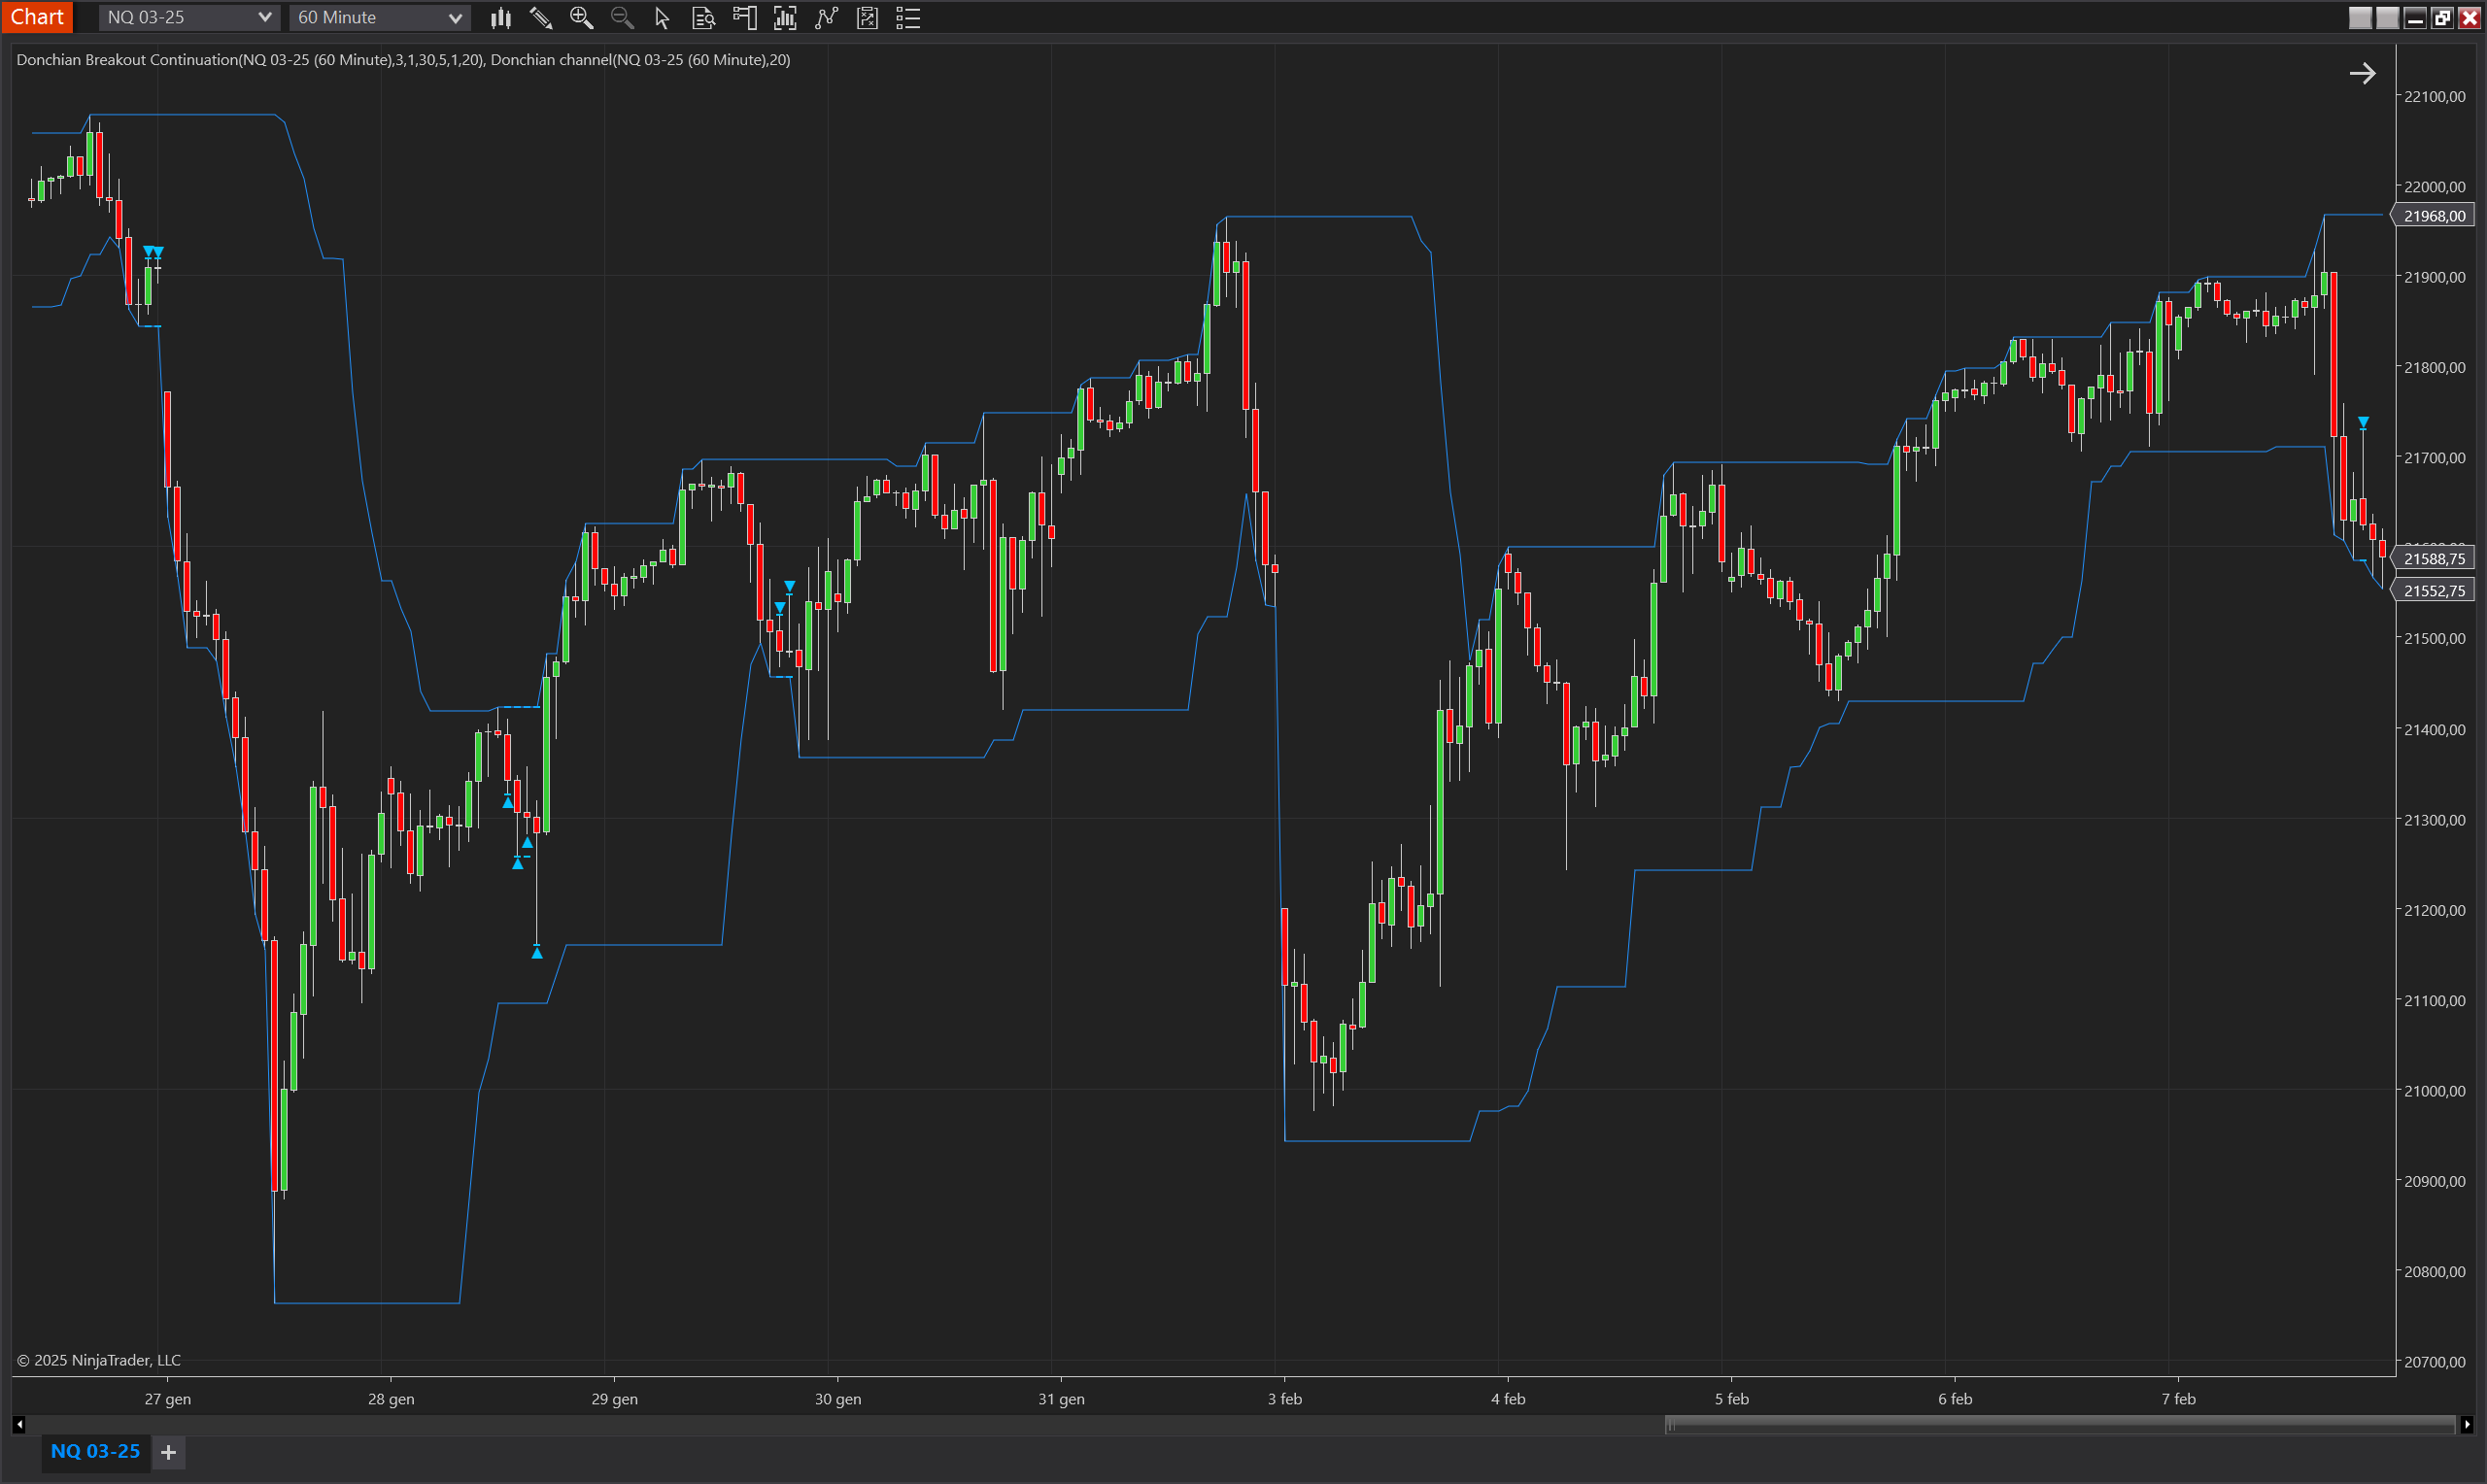
The Donchian Breakout Continuation indicator is designed to identify and signal breakout continuation setups based on the Donchian Channel. It tracks price movement relative to the upper and lower Donchian bands, detecting a load period where price remains within a range, followed by a breakout attempt, a pause, and then a potential continuation move.
A signal is generated when the price resumes movement in the breakout direction after the pause, helping traders recognize structured breakout opportunities. The indicator also plots reference levels for the breakout and pause zones, making it easier to visualize market structure.
Unlike other breakout models that rely on daily highs and lows, this approach adapts dynamically to Donchian Channel levels, making it suitable for various timeframes and instruments.
Key Features
- Breakout Structure Analysis – Detects a sequence of load, breakout, pause, and continuation around Donchian Channel levels.
- Dynamic Donchian-Based Levels – Uses upper and lower channel bands instead of static highs/lows.
- Customizable Breakout & Pause Conditions – Users define breakout and pause durations.
- Filters Opposing Breakouts – If a breakout occurs in one direction, the opposite signal is canceled.
- Intraday & Multi-Timeframe Use – Works across different instruments and timeframes where Donchian Channels apply.
Tips for Implementation
- Backtest Before Trading – This indicator is designed for analysis rather than direct trade execution. Test across different instruments.
- Combine with Trend Confirmation – Use alongside moving averages or trend filters to identify strong continuation setups.
- Avoid Low-Volatility Conditions – If price repeatedly fails to break Donchian levels, consider adjusting the Load Period setting.
- Adapt to Different Timeframes – Works well on intraday and swing trading setups by adjusting the Donchian Period and Load Period.
- Use for Trade Structuring – Ideal for identifying when price respects Donchian boundaries before committing to a trade.
Parameters
Period
- Type: int
- Description: The period used for calculating the Donchian Channel upper and lower bands.
- Default Value: 20
- Valid Values: Any positive integer greater than 0.
Load Period
- Type: int
- Description: The number of bars where the Donchian upper or lower level remains unchanged, signaling a potential breakout setup.
- Default Value: 30
- Valid Values: Any positive integer greater than 0.
Breakout Min Bars
- Type: int
- Description: The minimum number of bars required for a breakout attempt before a pause.
- Default Value: 1
- Valid Values: Any positive integer greater than 0.
Breakout Max Bars
- Type: int
- Description: The maximum number of bars allowed for a breakout attempt before a pause.
- Default Value: 3
- Valid Values: Any positive integer greater than Breakout Min Bars.
Min Pause Bars
- Type: int
- Description: The minimum number of bars required for a pause before a potential continuation move.
- Default Value: 1
- Valid Values: Any positive integer greater than 0.
Max Pause Bars
- Type: int
- Description: The maximum number of bars allowed for a pause before a breakout continuation move.
- Default Value: 5
- Valid Values: Any positive integer greater than Min Pause Bars.
Plot Offset (Ticks)
- Type: int
- Description: Represents the distance in ticks between the plotted signal and the bar high/low, improving visualization.
- Default Value: 5
- Valid Values: Any positive integer greater than 0.
Plots
IndicatorSignalUp
- Type: Plot
- Style: Triangle Up
- Color: DeepSkyBlue
- Description: Marks when an upward breakout continuation occurs after the pause period, confirming potential trade analysis.
SignalUpUpperLevel
- Type: Plot
- Style: Hash
- Color: DeepSkyBlue
- Description: Represents the Donchian upper breakout level before the pause, acting as a key reference for potential continuation.
SignalUpLowerLevel
- Type: Plot
- Style: Hash
- Color: DeepSkyBlue
- Description: Represents the pause low level, giving insight into the market structure for upward breakout continuation trades.
IndicatorSignalDown
- Type: Plot
- Style: Triangle Down
- Color: DeepSkyBlue
- Description: Marks when a downward breakout continuation occurs after the pause period, confirming potential trade analysis.
SignalDownUpperLevel
- Type: Plot
- Style: Hash
- Color: DeepSkyBlue
- Description: Represents the pause high level, providing reference for downward breakout continuation trades.
SignalDownLowerLevel
- Type: Plot
- Style: Hash
- Color: DeepSkyBlue
- Description: Represents the Donchian lower breakout level before the pause, acting as a key reference for potential downward breakouts.