Fair Value Gap Poc Retest
Description
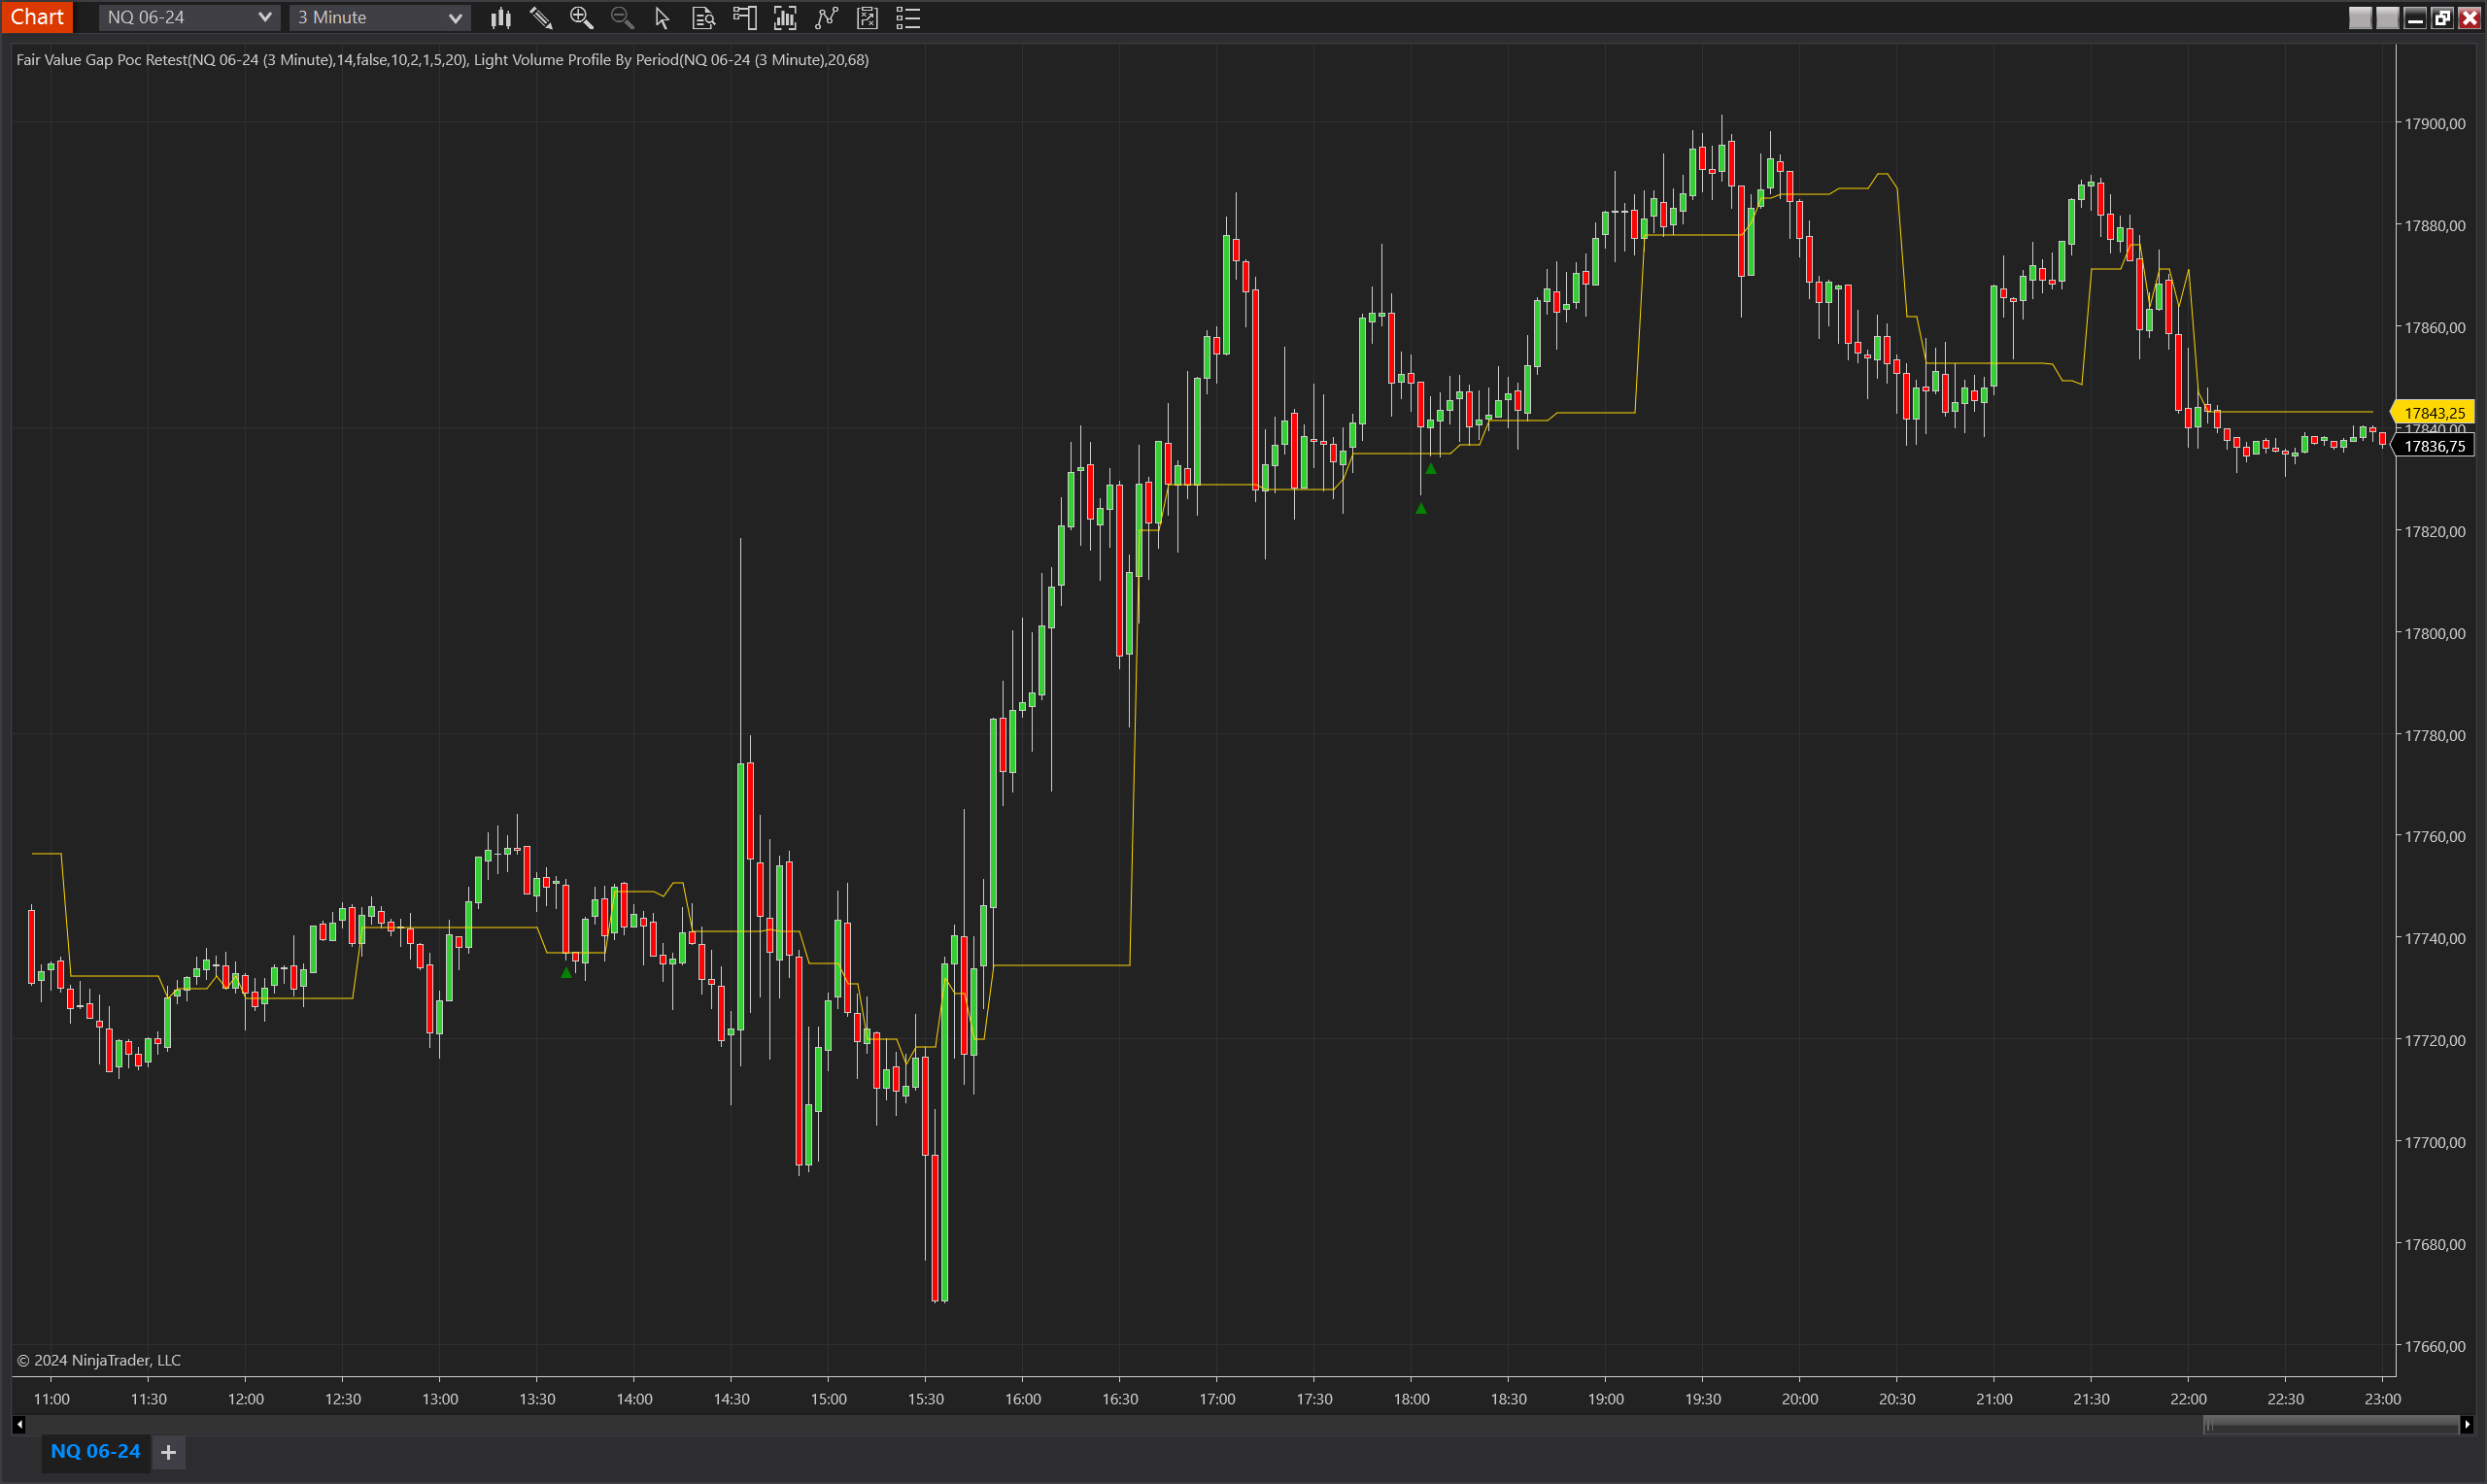
The "Fair Value Gap Poc Retest" indicator is designed for NinjaTrader and identifies trading opportunities based on the retest of a Point of Control (POC) that was established after a fair value gap. This indicator is particularly useful in markets where price action tends to return to areas of significant volume after making substantial moves away.
Key Features
- POC Retest Detection: Identifies when the price retests the POC after moving away, potentially signalling a reversal or continuation based on volume concentration.
- Volume Profile Utilization: Leverages volume profile data to determine the POC within a given period, ensuring that the signals are based on substantial trading activity.
- Adjustable Sensitivity: Allows for customization of the distance from the POC and the ATR (Average True Range) multiple to fine-tune the indicator's responsiveness to market conditions.
- Formation Validity: Includes parameters to define the maximum number of bars for a formation to be considered valid, helping to filter out less probable signals.
Tips for Implementation
- Backtesting: Thoroughly backtest the indicator under various market conditions to determine the optimal settings for the Volume Profile Period, Min Ticks From POC, and ATR multiples. This ensures the signals align well with your trading strategy.
- Integration with Other Indicators: Combine with momentum indicators like RSI or MACD to confirm the signal strength when a POC retest occurs, potentially increasing the success rate of trades.
- Risk Management: Implement strict risk management rules, considering the Max Closes Beyond Level setting to define stop-loss points based on how often the price closes beyond the POC without following through.
- Tick Replay Feature: Ensure that the Tick Replay feature is enabled in NinjaTrader to accurately display historical values necessary for the indicator's calculations. This is crucial for the analysis of past volume data.
This setup can be especially powerful in volatile markets where price frequently returns to test previously established volume areas, offering traders strategic entry and exit points. Adjust the Plot Offset to ensure that the signals do not overlap significantly with candlesticks, maintaining clarity on the chart.
Parameters
Volume Profile Period
- Type: Integer
- Description: Specifies the number of bars over which the volume profile is calculated to determine the Point of Control (POC).
- Range: 1 to maximum allowed by the platform.
Formation Max Validity
- Type: Integer
- Description: Sets the maximum number of bars a potential signal can take to validate, beyond which the setup is discarded.
- Range: 1 to maximum allowed by the platform.
Min Ticks From POC
- Type: Integer
- Description: Defines the minimum number of ticks away from the POC that price must move to qualify for a retest scenario.
- Range: 1 to maximum allowed by the platform.
Min ATR Multiples From POC
- Type: Double
- Description: Specifies how many multiples of the Average True Range (ATR) away from the POC the price must reach to trigger a signal.
- Range: 1.0 to maximum allowed by the platform.
Atr Period
- Type: Integer
- Description: Determines the period over which the ATR is calculated, used in conjunction with the Min ATR Multiples From POC parameter.
- Range: 1 to maximum allowed by the platform.
Max Closes Beyond Level
- Type: Integer
- Description: The maximum number of times the price can close beyond the POC level without invalidating the setup.
- Range: 0 to maximum allowed by the platform.
Constant POC
- Type: Boolean
- Description: If enabled, requires the POC to remain unchanged for the signal to remain valid.
- Options: True (Enabled), False (Disabled)
Plot Offset (Ticks)
- Type: Integer
- Description: Adjusts the distance in ticks between the plotted signal and the actual price bar to avoid overlap and improve visibility.
- Range: 1 to maximum allowed by the platform.
Plots
IndicatorSignalUp
- Type: Plot
- Style: Triangle Up
- Color: DeepSkyBlue
- Description: Indicates a bullish retest signal when the price moves back up to the POC after a downward move, signifying potential buying opportunities. The signal is plotted as an upward-pointing triangle below the price bar.
IndicatorSignalDown
- Type: Plot
- Style: Triangle Down
- Color: Red
- Description: Signifies a bearish retest signal when the price moves back down to the POC after an upward move, indicating potential selling opportunities. The signal is plotted as a downward-pointing triangle above the price bar.