Delta Trap
Description
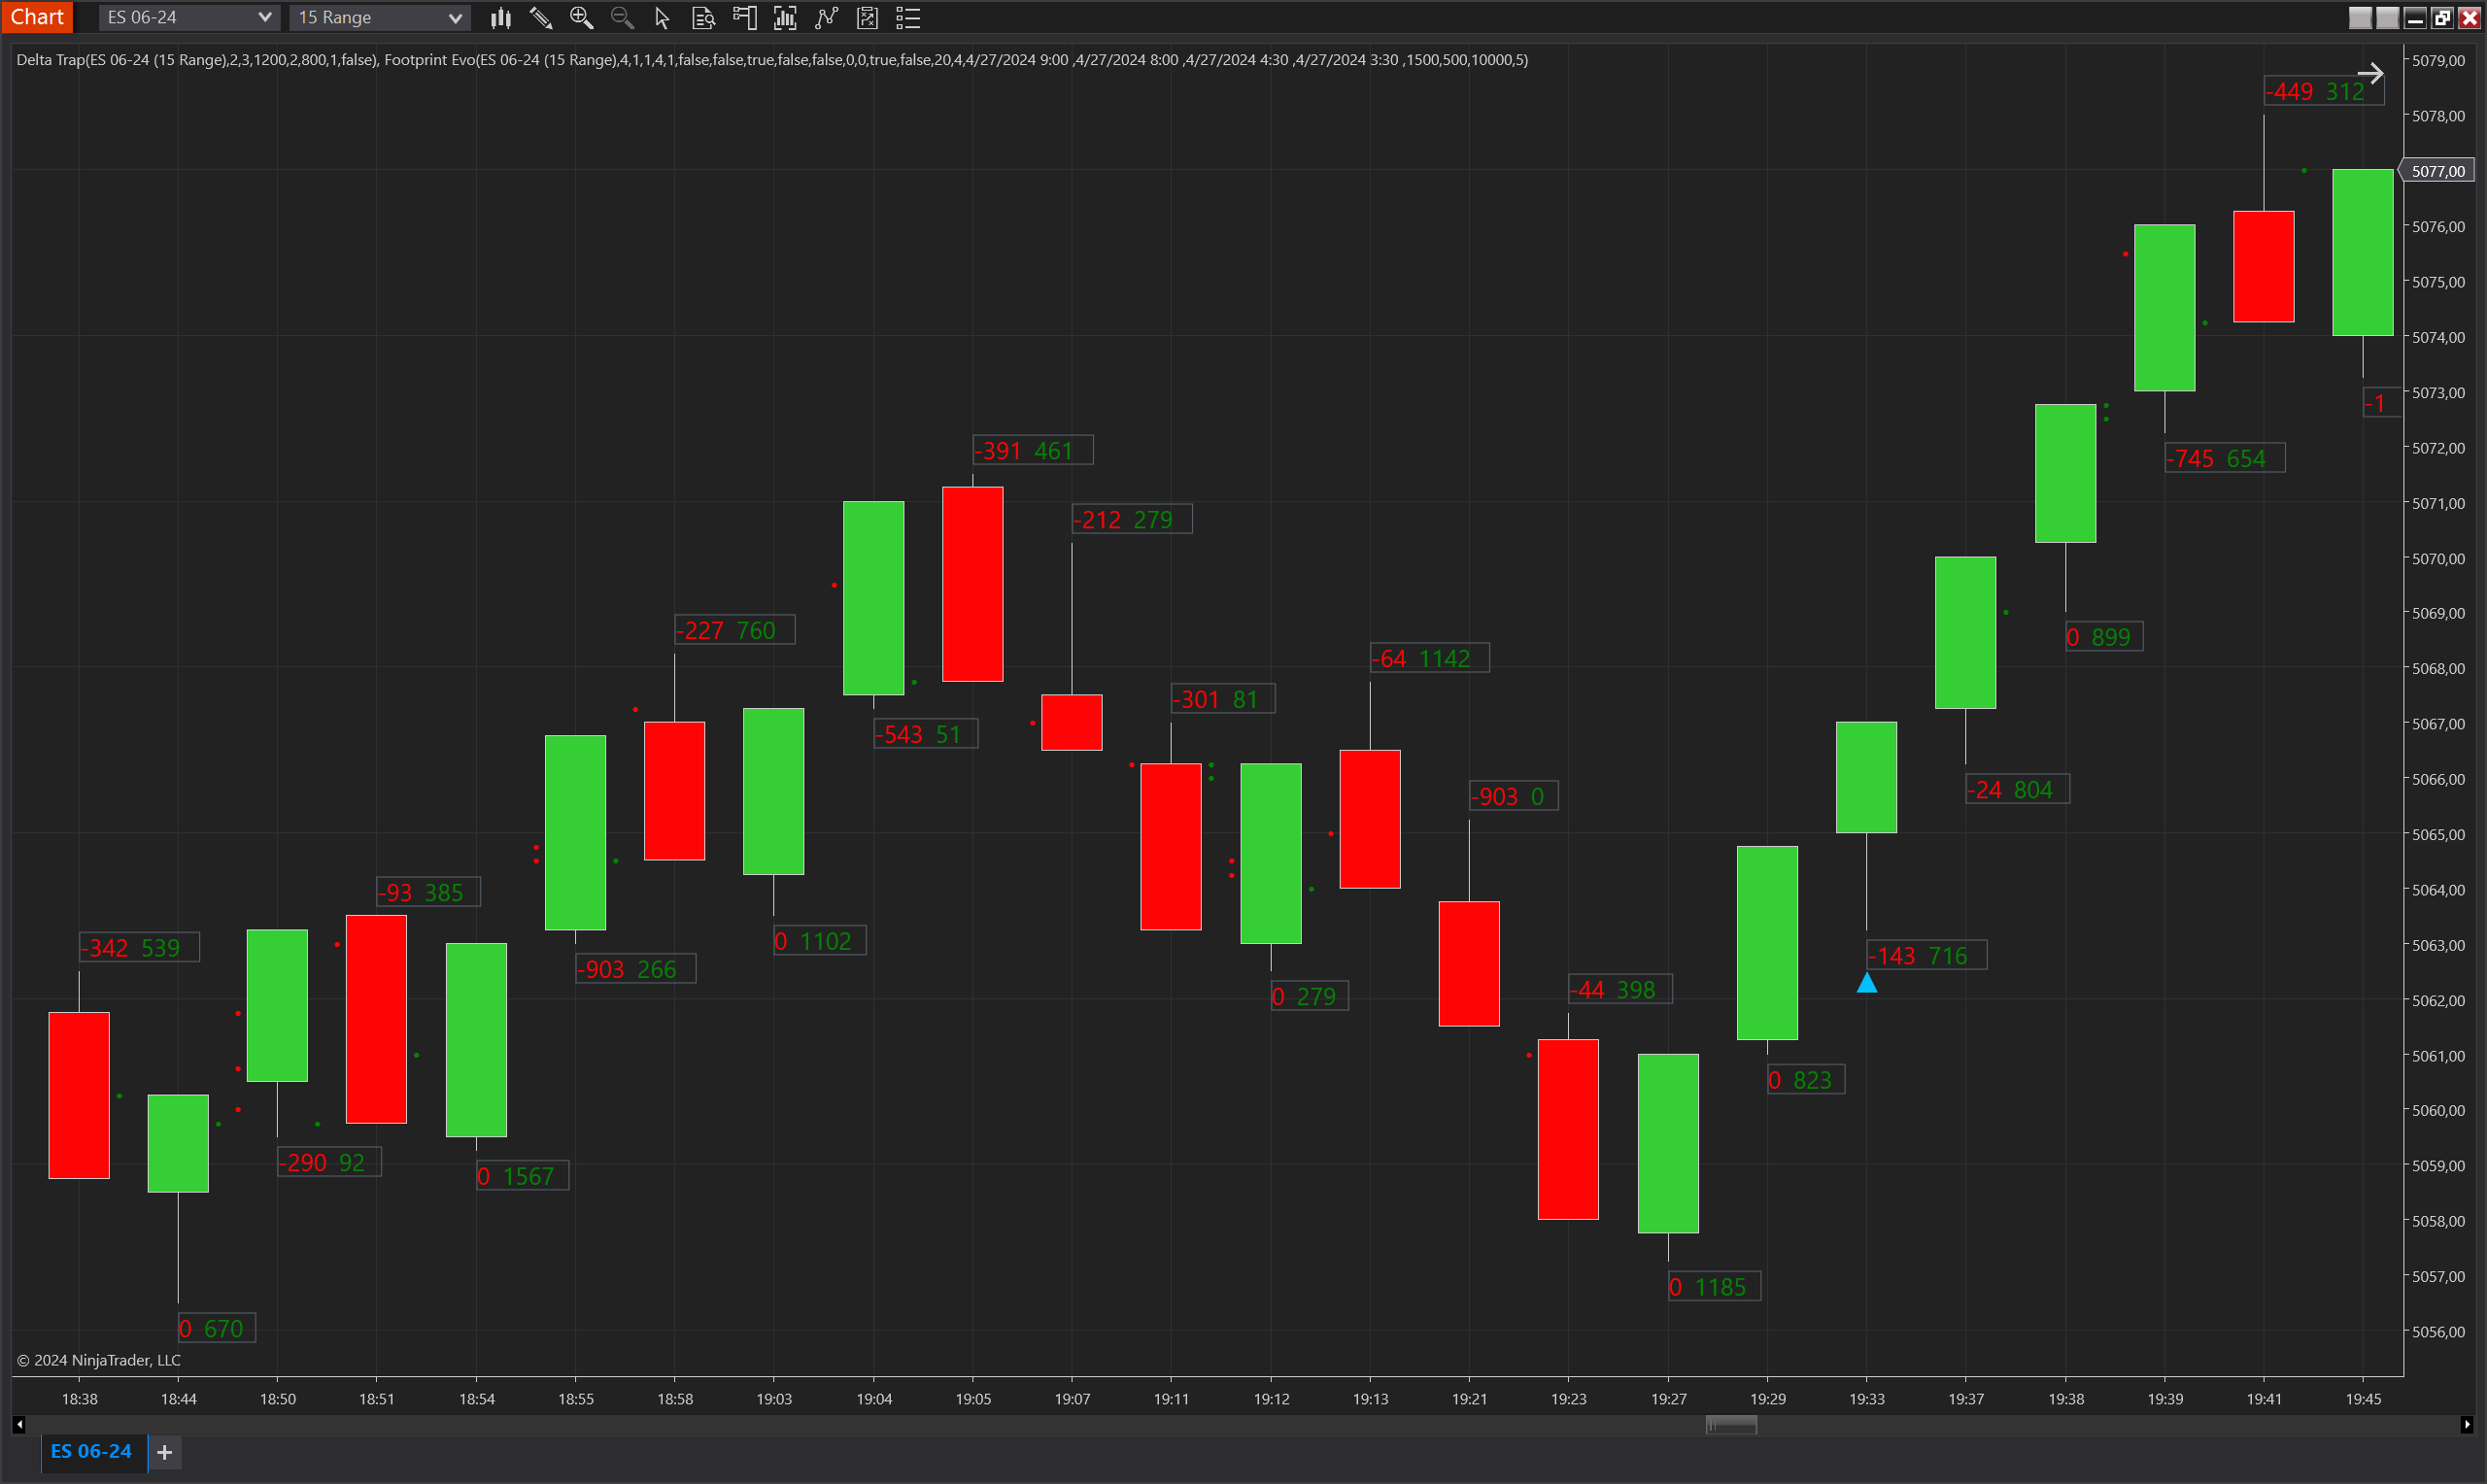
The Delta Trap indicator identifies potential trading signals based on the concept of trapped market participants using delta analysis from footprint charts. The indicator detects scenarios where significant order imbalances might result in price reversals, marking opportunities for contrarian trading entries.
Key Features
- Trapped Delta Detection: Identifies significant positive or negative delta accumulations that indicate potential price reversals.
- Reversal Confirmation: Uses the presence of minimum reverse delta in a specified number of bars to confirm potential reversals.
- Adjustable Parameters: Allows customization of delta thresholds, the validity of trapped deltas, and the minimum bars for reversals to cater to various trading styles and market conditions.
- Visual Signals: Plots signals on the chart to highlight potential entry points, enhancing visual analysis and decision-making.
Tips for Implementation
- Parameter Tuning: Adjust the 'Min Trapped Delta', 'Bars Trapped Delta', and reversal parameters according to the volatility and typical volume profile of the market you are trading.
- Contextual Use: Best used in markets where delta imbalances frequently precede price reversals, such as futures and stocks with significant order flow transparency.
- Combination with Other Indicators: Combine with volume analysis tools or other order flow indicators to confirm signals and enhance the reliability of the predictions.
- Backtesting: Thoroughly backtest the indicator under various market conditions to understand its behaviour and tweak parameters for optimal performance.
- Risk Management: Always use in conjunction with sound risk management practices, as trading on order flow imbalances alone can expose traders to significant risks if not managed properly.
Parameters
Min Trapped Delta
- Type: Integer
- Description: The minimum delta required to consider the delta as "trapped". This parameter sets the threshold for how strong an imbalance needs to be to trigger a potential signal.
- Default Value: 1000
Bars Trapped Delta
- Type: Integer
- Description: The number of consecutive bars over which the trapped delta should occur. This helps define the timeframe for the accumulation of imbalances.
- Default Value: 2
Trapped Delta Validity
- Type: Integer
- Description: The number of bars within which a reversal should occur after a trapped delta is identified to consider the signal valid.
- Default Value: 1
Min Reverse Delta
- Type: Integer
- Description: The minimum delta in the opposite direction required to validate a potential reversal signal.
- Default Value: 1200
Min Reverse Delta Bars
- Type: Integer
- Description: The minimum number of bars over which the reversal delta should be observed.
- Default Value: 2
Max Reverse Delta Bars
- Type: Integer
- Description: The maximum number of bars over which the reversal delta can be observed before the signal is no longer considered valid.
- Default Value: 4
Value Area Gap
- Type: Boolean
- Description: Determines whether a value area gap must be present to validate the signal.
- Default Value: False
Plot Offset (Ticks)
- Type: Integer
- Description: The distance, measured in ticks, between the plotted signal and the high or low point of the bar. This helps to visually separate the signal from the price action for clarity.
- Default Value: 3
Plots
IndicatorSignalUp
- Type: Plot
- Style: Triangle Up
- Color: DeepSkyBlue
- Description: Marks the potential buy signal where a positive reversal is anticipated. The plot is positioned based on the bar’s low adjusted by the plot offset.
IndicatorSignalDown
- Type: Plot
- Style: Triangle Down
- Color: DeepSkyBlue
- Description: Indicates the potential sell signal where a negative reversal is expected. This plot appears above the bar’s high, adjusted by the plot offset.