Up Down Fair Value Gap Index
Description
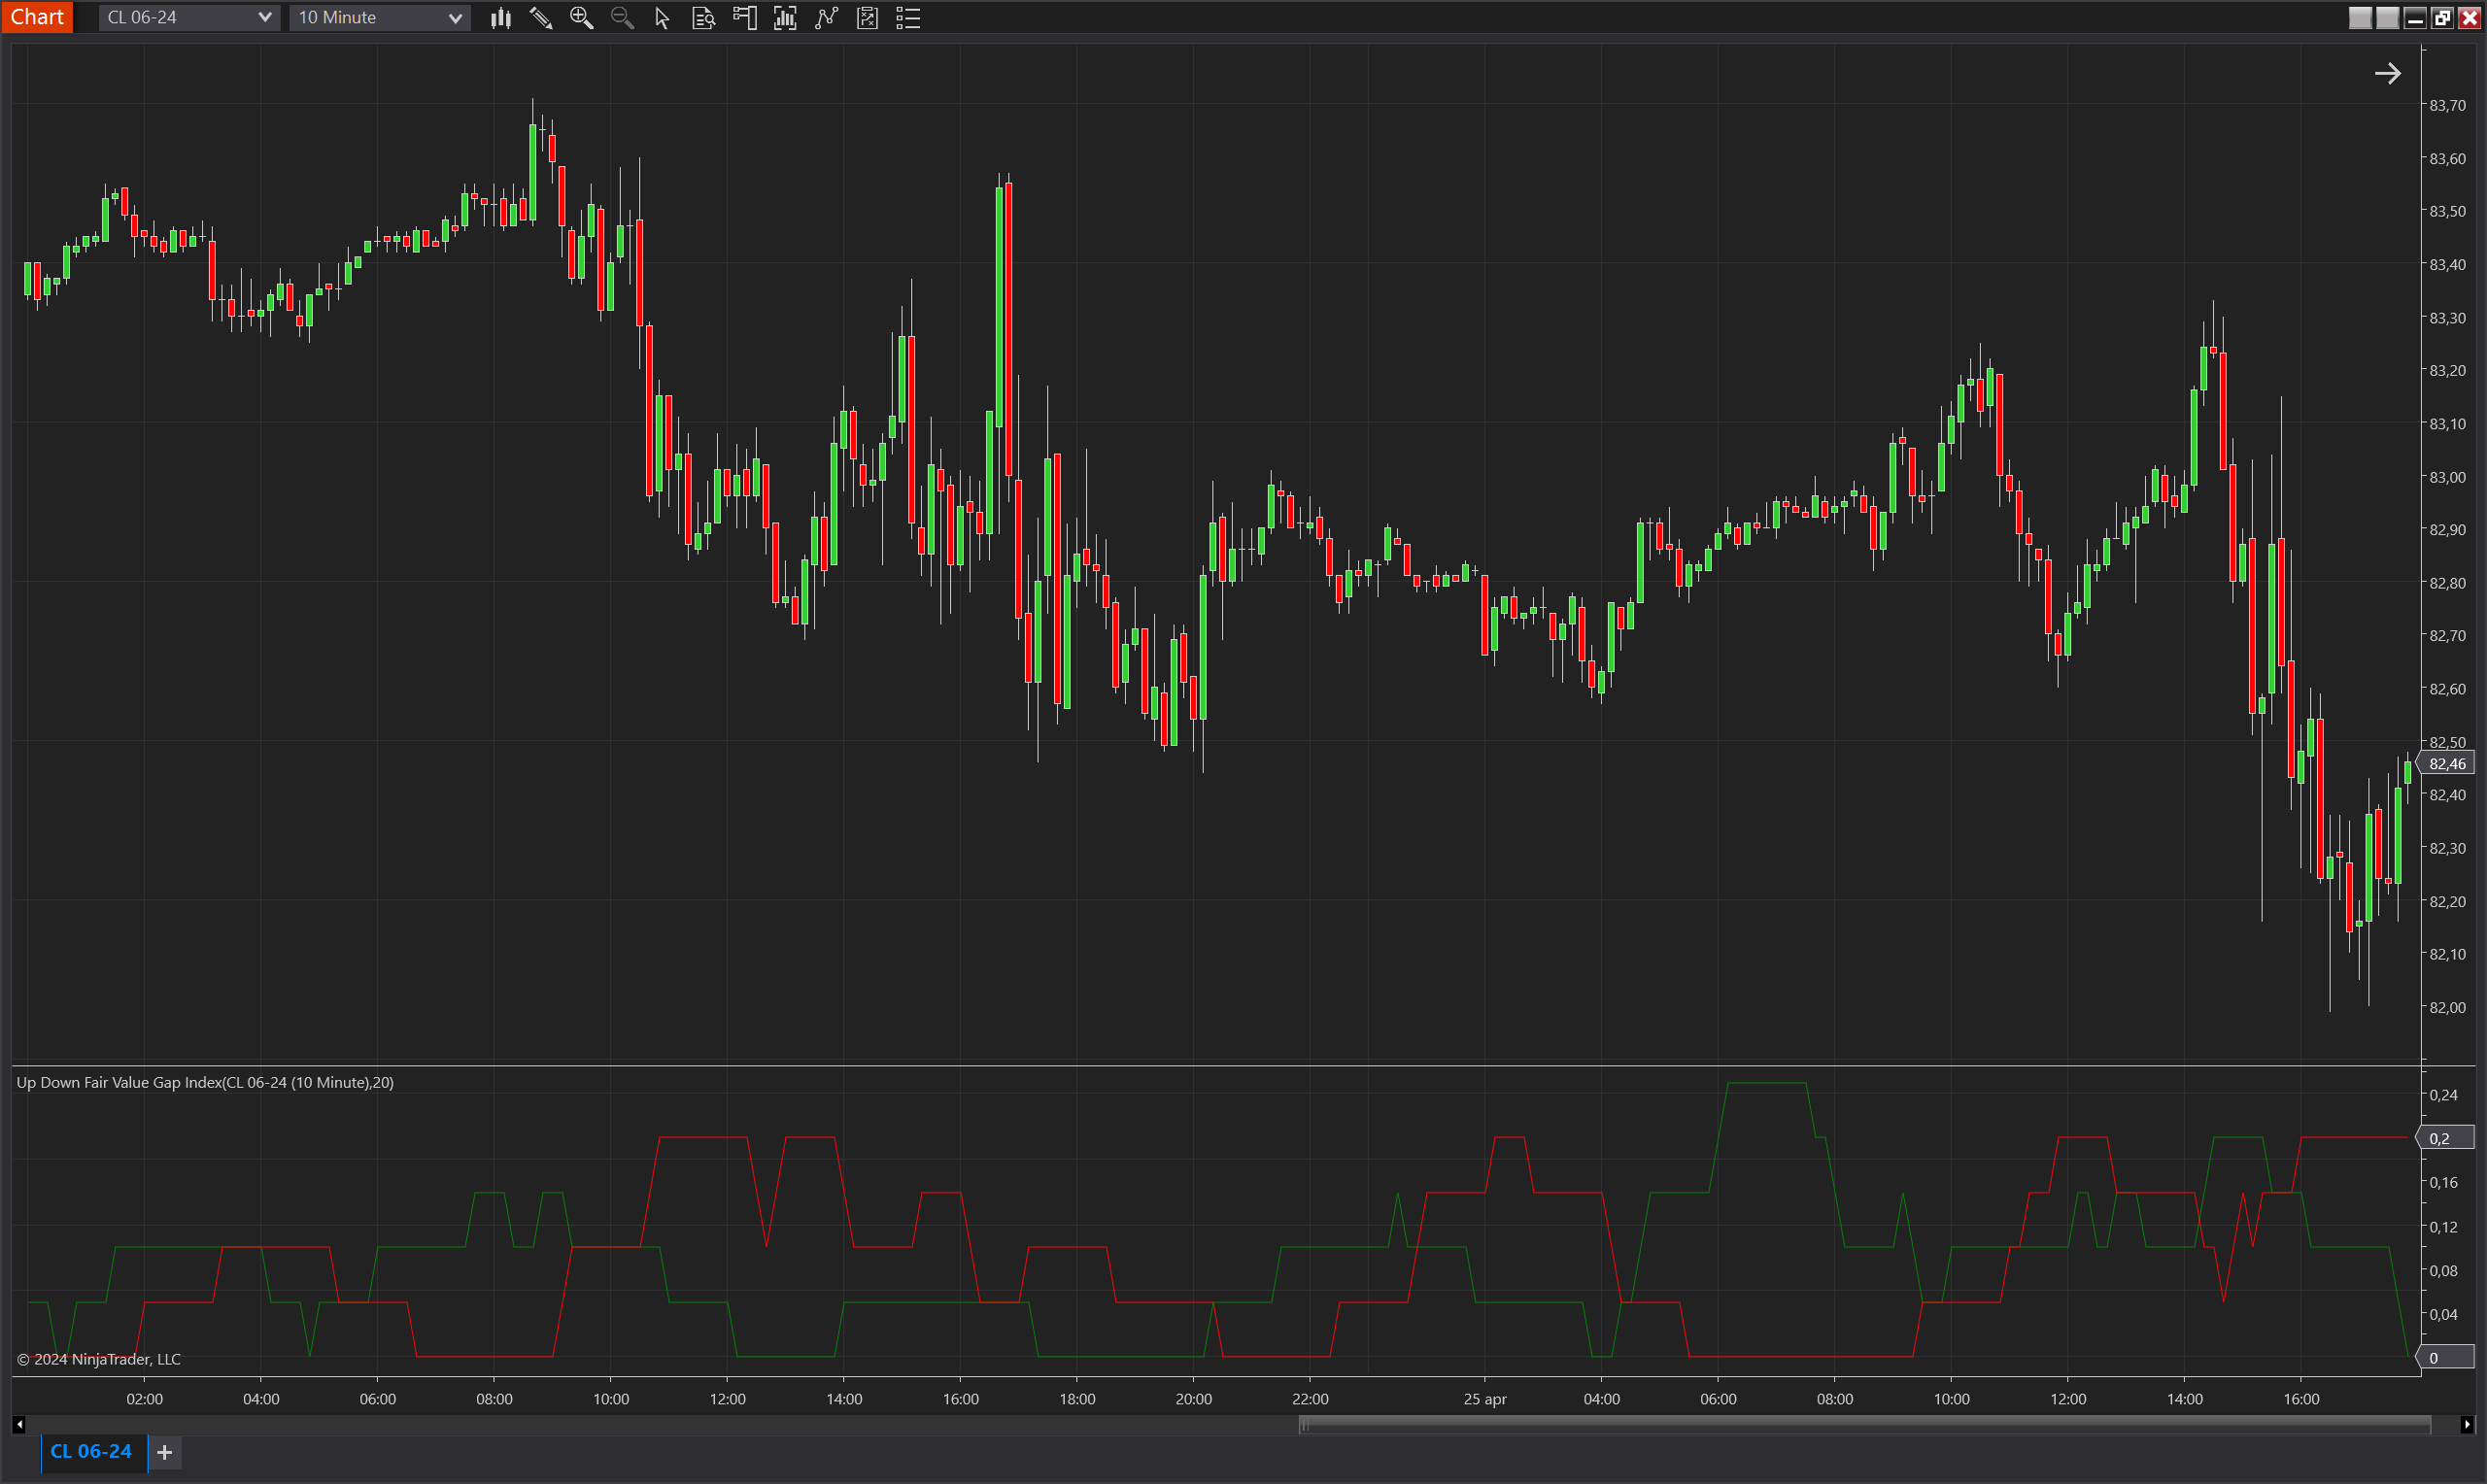
The Up Down Fair Value Gap Index is a sophisticated indicator designed for NinjaTrader 8 that separately tracks upward and downward fair value gaps over a specified period. This index is essential for identifying imbalances in buying and selling pressure, indicating potential reversal zones or continuation patterns based on the occurrence of fair value gaps.
Key Features
- Separate Tracking for Up and Down Gaps: This indicator divides the tracking of fair value gaps into up and down directions, offering a detailed analysis of market dynamics from both bullish and bearish perspectives.
- Fair Value Gap Identification: It identifies when the current low is higher than a previous high (up gap) or when the current high is lower than a previous low (down gap), which are key signals of potential price imbalances.
- Proportional Index Calculation: Calculates the proportion of up and down fair value gaps within the specified period, providing a clear metric to assess the dominance of buying or selling pressures.
- Customizable Period: Allows users to set the period for analysis, adjusting the sensitivity of the indicator to align with different trading strategies and market conditions.
Tips for Implementation
- Identify Market Reversals: Use the index to spot potential market reversals. A sudden increase in down gaps during an uptrend may suggest bearish reversal potential, while an increase in up gaps during a downtrend might indicate bullish reversal opportunities.
- Support and Resistance Levels: Combine the index readings with traditional support and resistance analysis. Fair value gaps often occur around these key levels, providing additional insights for entry or exit decisions.
- Combination with Momentum Indicators: Pair the Up Down Fair Value Gap Index with momentum indicators to confirm the strength behind the observed price imbalances.
- Threshold Analysis: Utilize the threshold line to highlight significant changes in the index values. Crossings above or below this line can indicate shifts in market sentiment and potential trading opportunities.
- Adjust Period for Market Conditions: Modify the period parameter based on the asset's volatility. Shorter periods can be used for fast-moving markets to capture rapid changes, whereas longer periods might be better suited for markets with slower dynamics.
Parameters
Period
- Type: int
- Description: Specifies the number of bars over which the index is calculated. This setting influences how the indicator aggregates instances of fair value gaps, affecting its responsiveness to market changes.
- Default Value: 10
- Valid Values: Any positive integer, providing flexibility for traders to adapt the indicator to their specific needs.
Plots
ValueUp
- Type: Plot
- Color: Green
- Description: Displays the calculated index value for upward fair value gaps, showing the proportion of periods that registered upward imbalances. This plot helps visualize bullish pressure and potential buying opportunities.
ValueDown
- Type: Plot
- Color: Red
- Description: Represents the calculated index value for downward fair value gaps, showing the proportion of periods that registered downward imbalances. This plot is useful for visualizing bearish pressure and potential selling opportunities.
Threshold
- Type: Line
- Color: Gray
- Description: A horizontal line, often set at a value like 0.5, used to delineate significant levels where the occurrence of fair value gaps becomes notably prominent, serving as a visual guide for identifying shifts in the balance of market pressures.