Close Uppper Percent Index
Description
Description
The Close Upper Percent Index is a specialized indicator developed for NinjaTrader 8 that measures the frequency with which the closing price of a bar finishes in the upper percentage of its range. This indicator is particularly useful for identifying bullish sentiment within individual bars, providing insights into potential buying pressure or bullish exhaustion. By calculating how often the close remains within a specified upper segment of the bar's total range, it offers a clear view of upward momentum or potential strengthening of bullish trends.
Key Features
- Percentage-Based Close Analysis: The indicator evaluates whether the close of each bar occurs within a specified upper percentage of its range, offering a precise metric to gauge bullish strength.
- Customizable Period and Percentage: Users can set the period over which the index is calculated and the percentage that defines the "upper" portion of the bar range. This flexibility allows the indicator to be fine-tuned for different trading styles and market conditions.
- Index Calculation: It compiles an index value based on the proportion of bars closing in the defined upper range across the specified period, illustrating the consistency of price closing towards the upper end of its daily range.
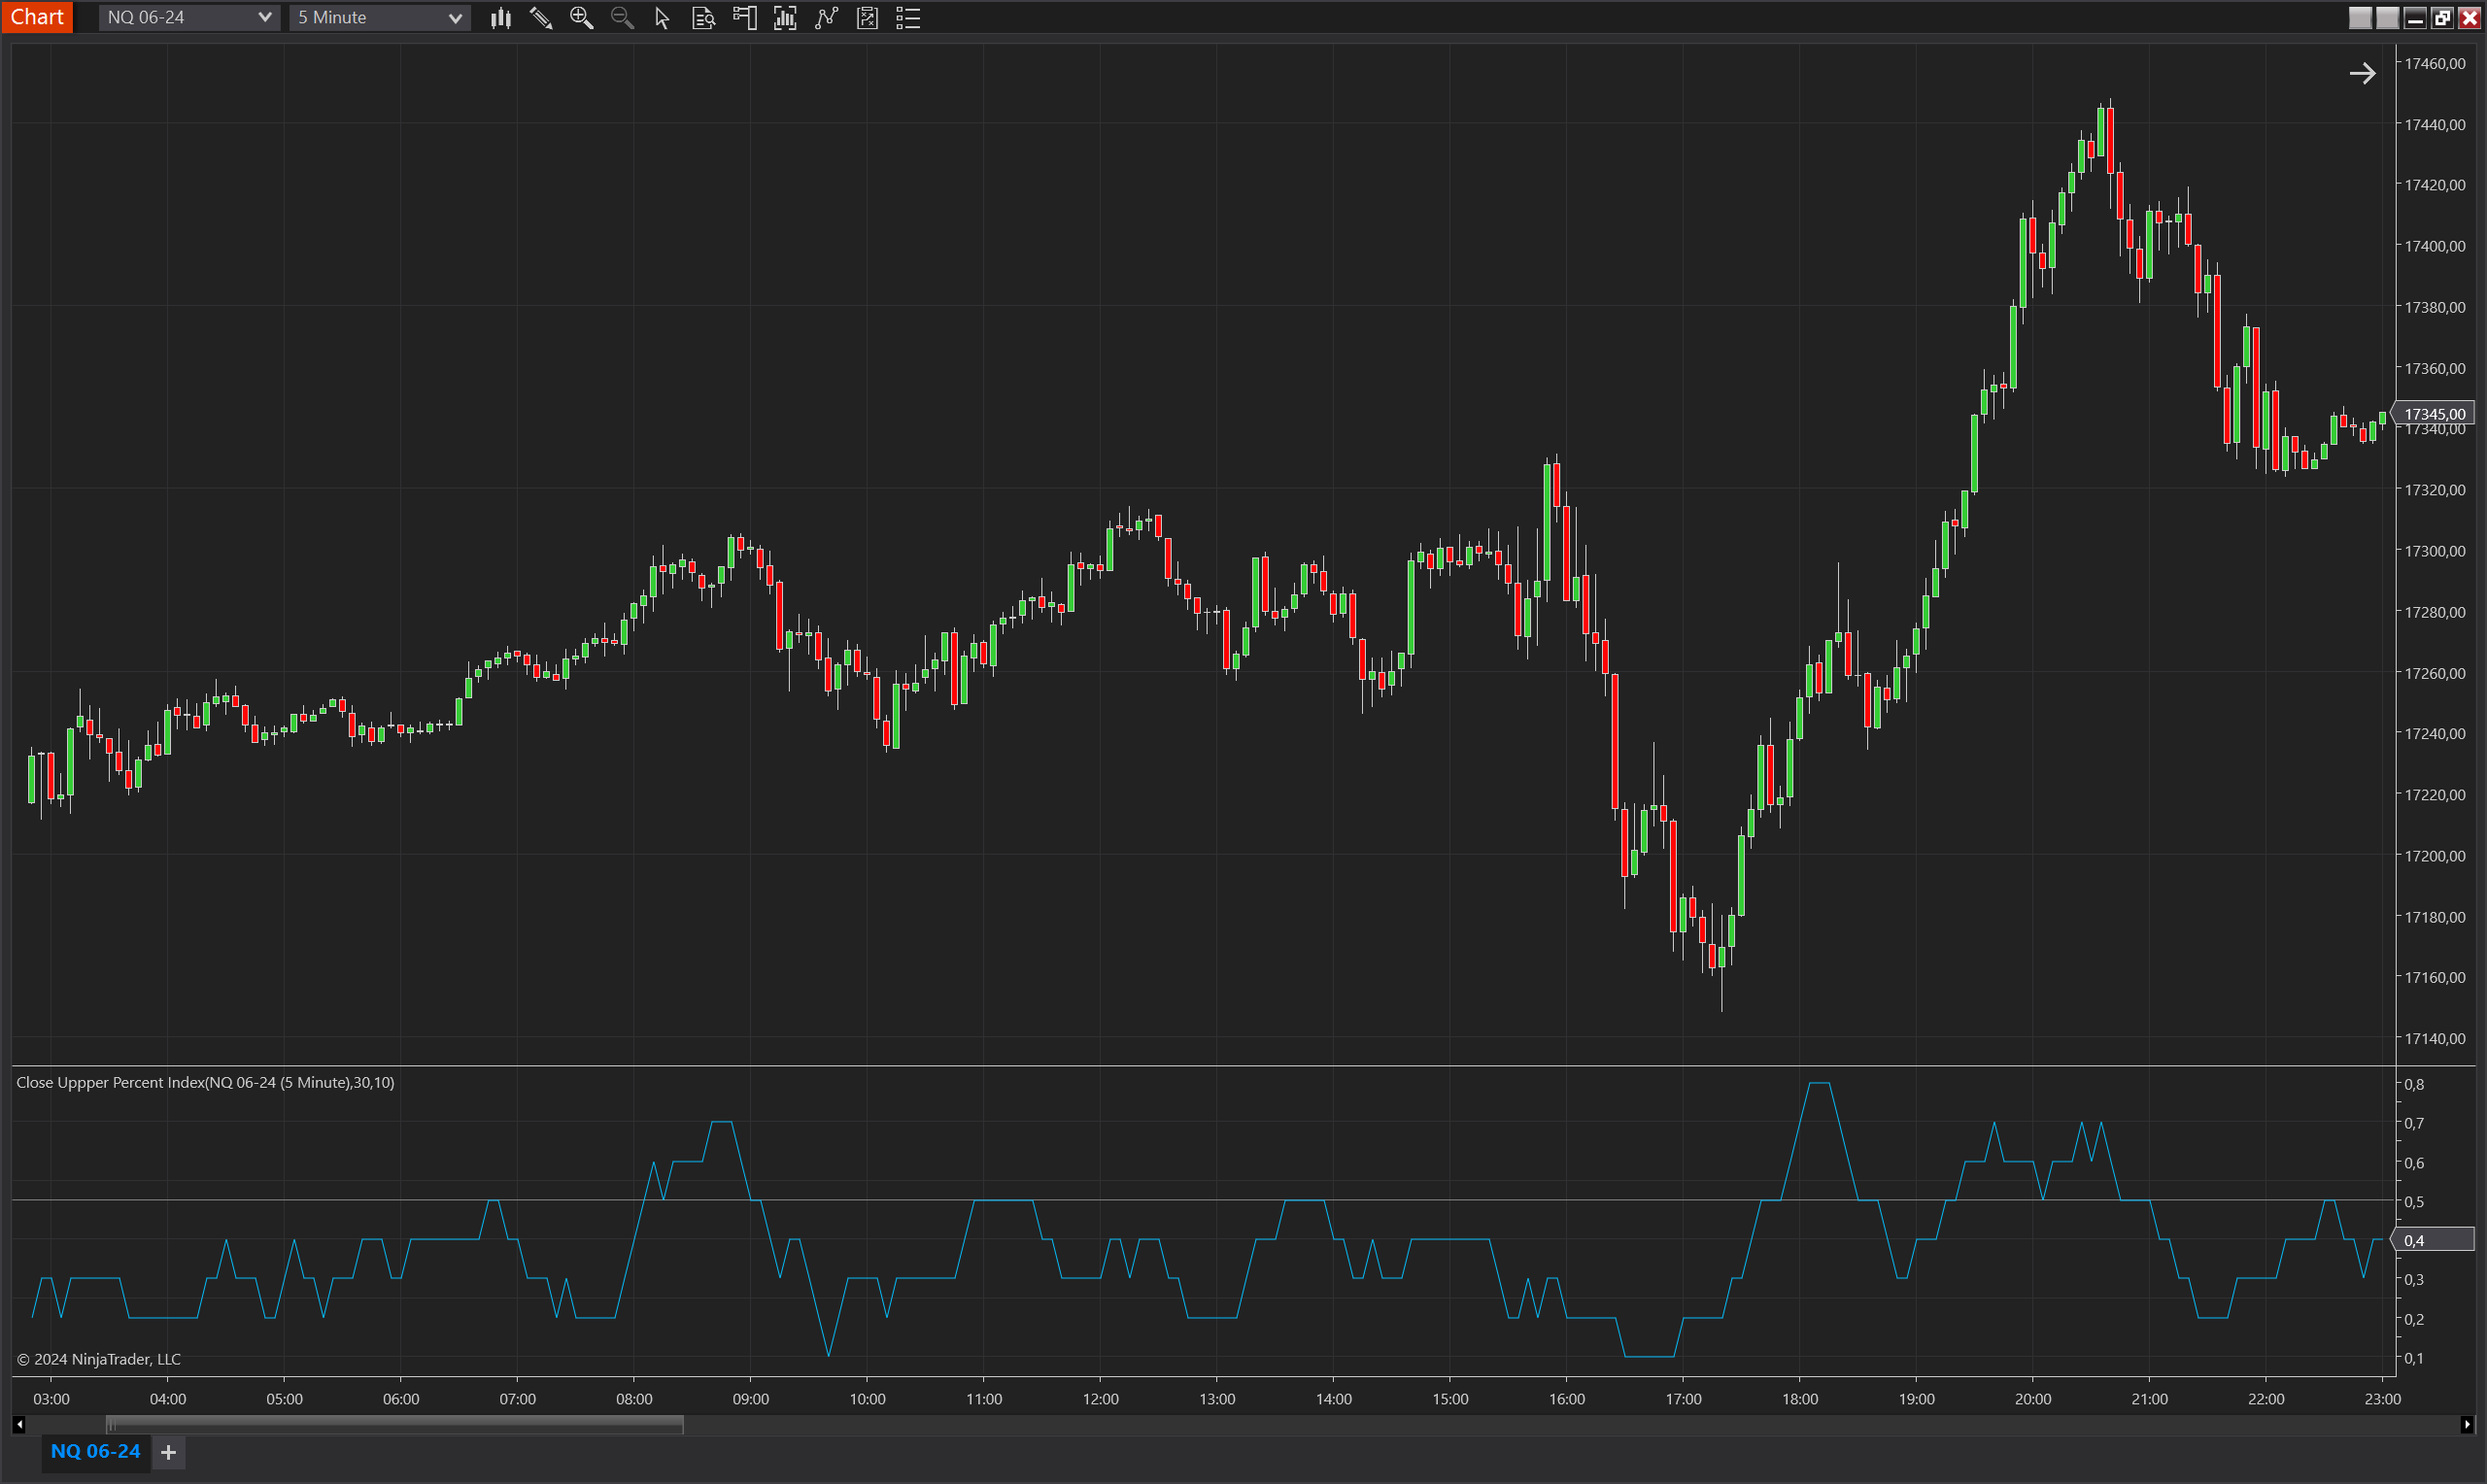
- Visual Display: Features a plot of the index values against a threshold line, enabling easy visualization of the trend in bullish closing positions.
Tips for Implementation
- Identify Bullish Sentiment: Use the indicator to spot periods where an unusually high number of bars close in the upper segment of their range, which could indicate increased bullish sentiment or potential upward momentum.
- Combination with Volume Indicators: Pair the Close Upper Percent Index with volume indicators to confirm whether the closes in the upper range are accompanied by high trading volume, which can validate the bullish signals.
- Optimize Settings for Volatility: Adjust the percentage parameter to account for different levels of market volatility. In more volatile markets, a higher percentage might be more indicative of significant bullish sentiment.
- Threshold Analysis: Utilize the threshold line to determine significant levels where the index value suggests a change in market conditions. Values persistently above the threshold might indicate strong bullish momentum or a potential breakout.
- Backtesting: As with any trading tool, backtesting the Close Upper Percent Index under historical market conditions is crucial to understanding its effectiveness and reliability before integrating it into a live trading strategy.
Parameters
Period
- Type: int
- Description: Specifies the number of bars over which the index is calculated. This parameter influences the aggregation of instances where the close is within the defined upper percentage of the bar range, providing insights into the duration and consistency of bullish sentiment.
- Default Value: 5
- Valid Values: Any positive integer, allowing traders to customize the sensitivity and reflectivity of the indicator according to their trading strategies.
Percentage
- Type: int
- Description: Sets the percentage of the bar range that defines the "upper" section where the close must occur for the index to increase. This percentage delineates the boundary for what is considered the upper part of the bar for this indicator's calculations.
- Default Value: 30
- Valid Values: Any integer from 0 to 100, providing flexibility to define how broadly or narrowly the "upper" section is considered within the bar's total range.
Plots
Value
- Type: Plot
- Color: DeepSkyBlue
- Description: Displays the calculated index value, showing the proportion of bars closing within the upper percentage of their range as defined by the indicator's settings. This plot visually represents the frequency of bullish closes relative to the total bars analyzed over the specified period, providing a visual metric of bullish trend strength.
Threshold
- Type: Line
- Color: Gray
- Description: A threshold line, typically set at a critical value (like 1.0), helps to quickly identify when the index value suggests that a significant portion of bars are closing in the upper part of their range, potentially indicating strong bullish sentiment or market exhaustion.