Close Above MA Index
Description
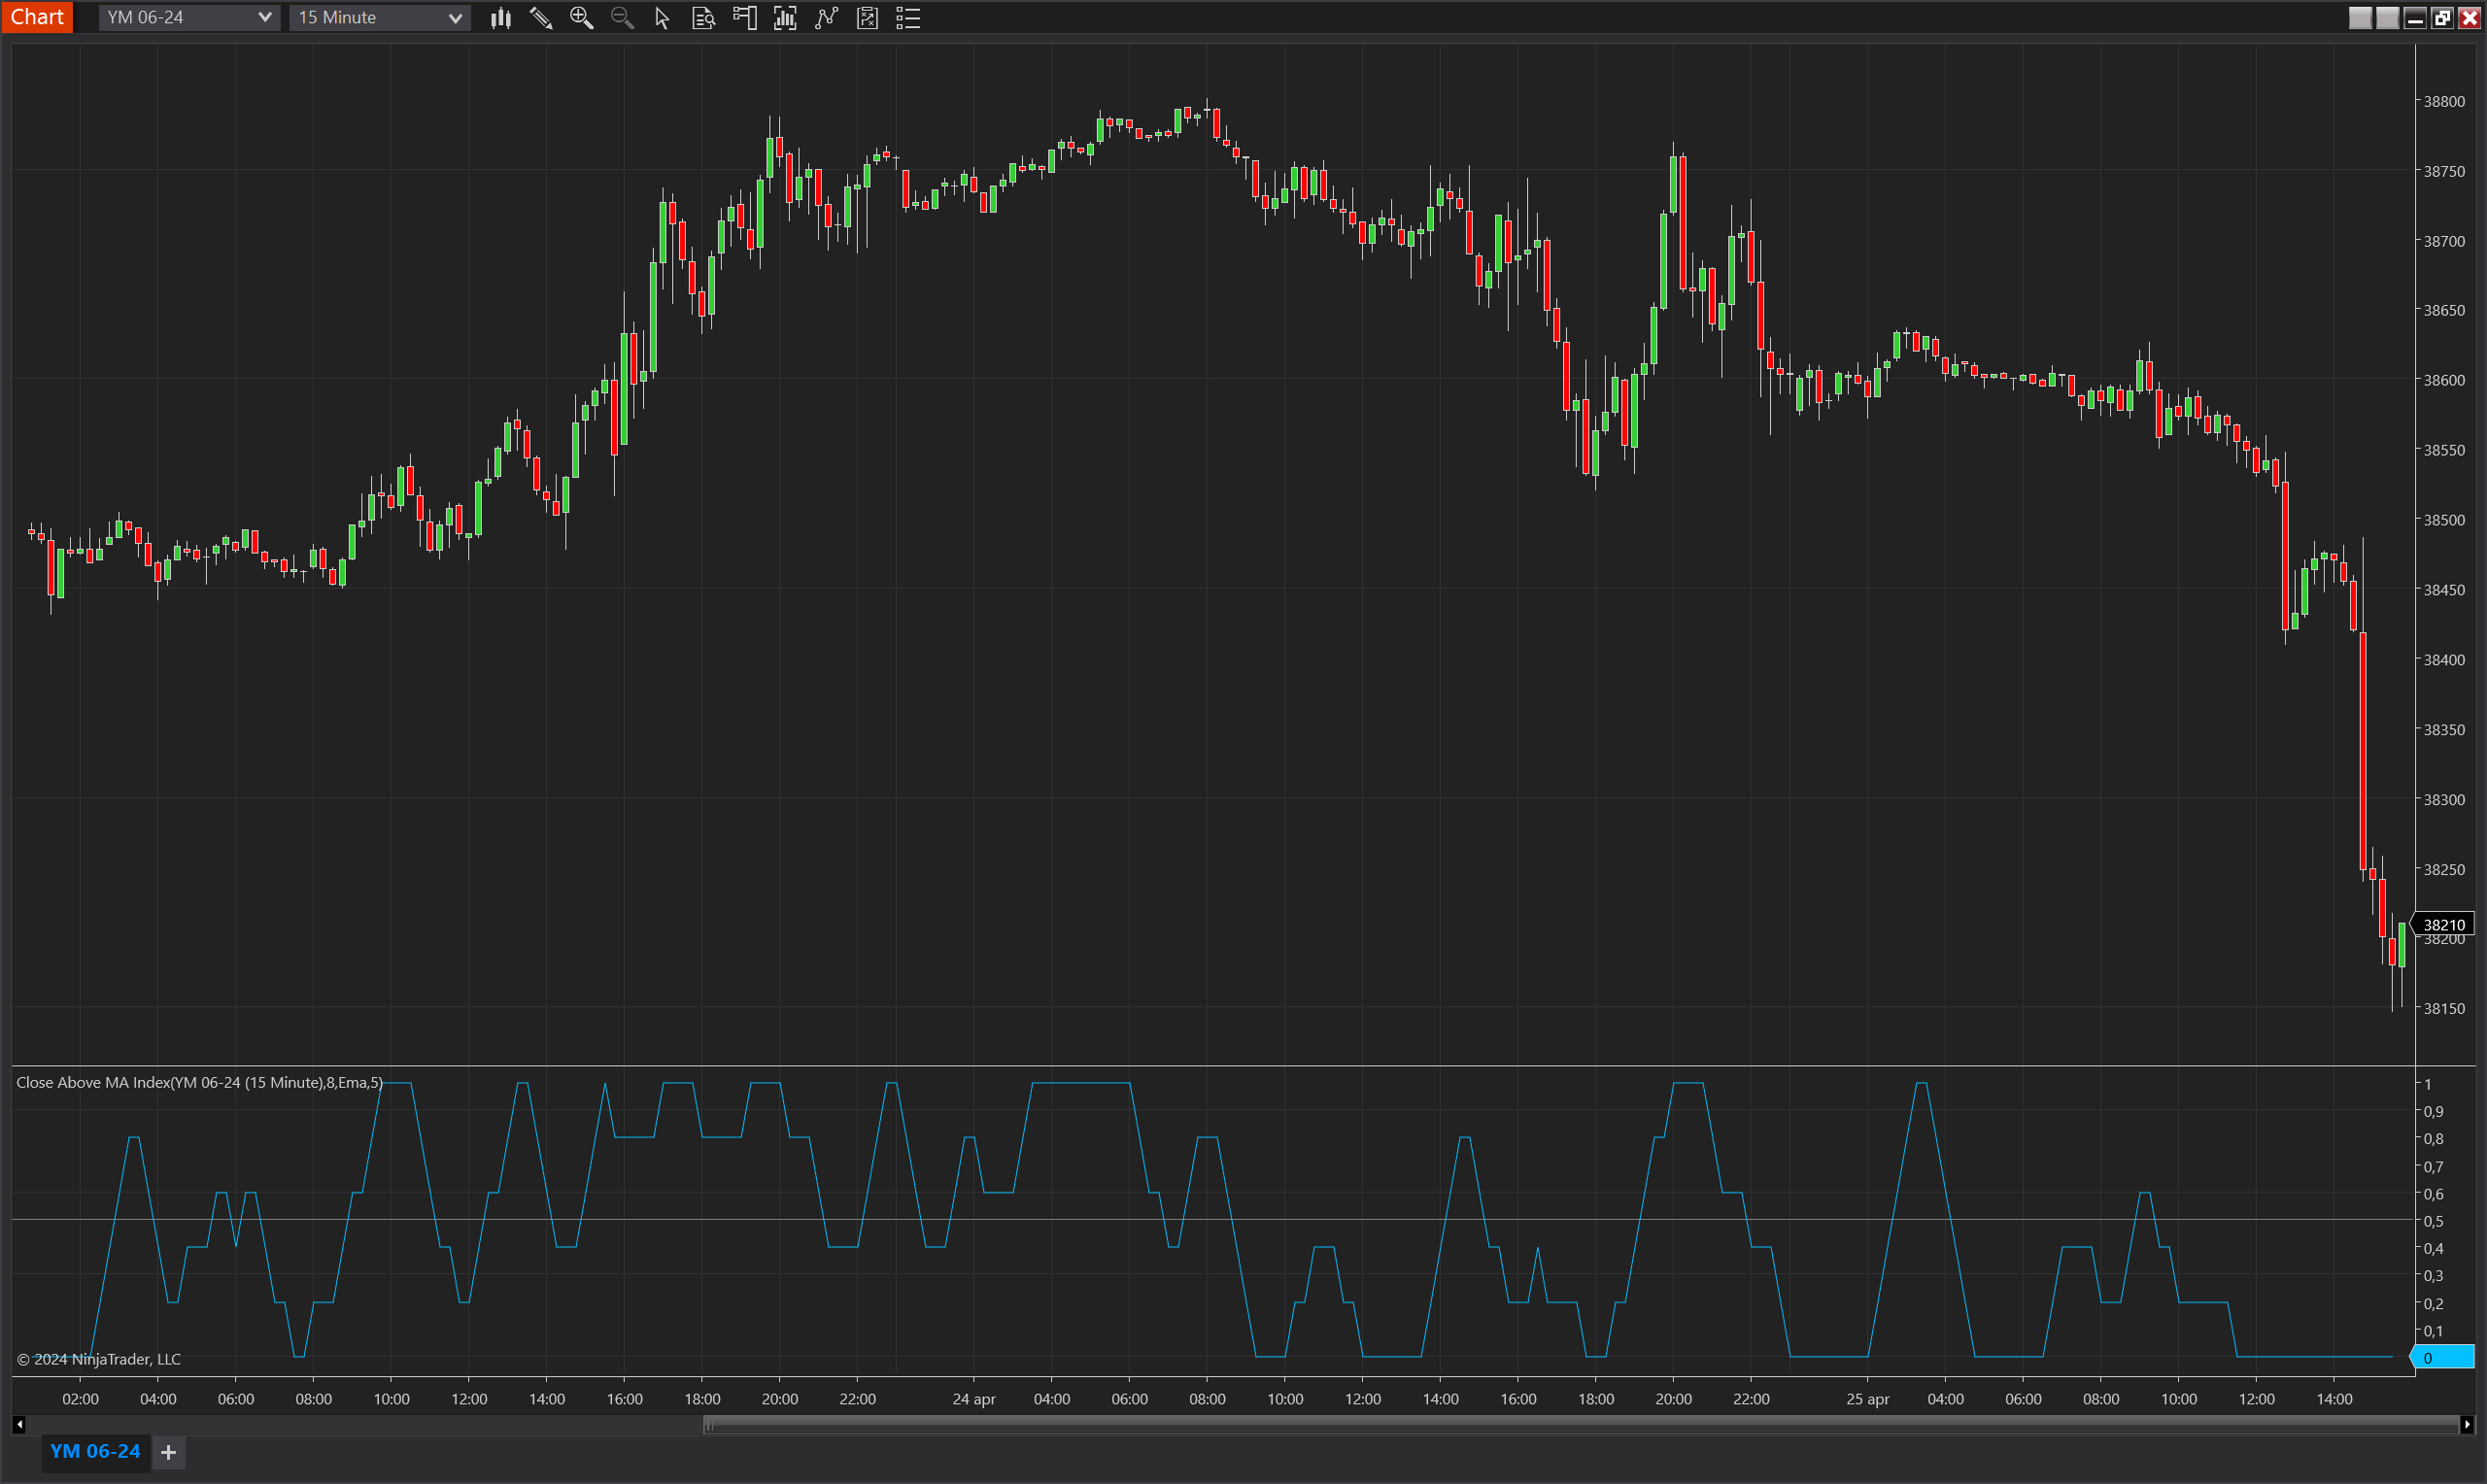
The Close Above MA Index is a specialized indicator designed for the NinjaTrader 8 platform that measures the frequency with which the closing price of a bar finishes above a selected moving average. This indicator provides a quantitative assessment of bullish persistence over a specified period, making it an invaluable tool for traders monitoring trend strength and stability. By calculating how often the close remains above the moving average, it offers a clear view of upward momentum or potential weakening of bullish trends.
Key Features
- Moving Average Flexibility: Supports multiple types of moving averages including Exponential Moving Average (EMA), Double Exponential Moving Average (DEMA), and Simple Moving Average (SMA), allowing traders to choose the average that best fits their trading strategy.
- Index Calculation: Computes an index value based on the proportion of bars closing above the moving average relative to the total bars over the designated period.
- Customizable Parameters: Traders can set the period for the moving average and the index calculation, tailoring the sensitivity and responsiveness of the indicator to their specific needs.
- Visual Representation: Features a plot of the index value, providing a visual metric of bullish trend endurance and making it easy to observe changes in trend dynamics.
Tips for Implementation
- Trend Confirmation: Use the Close Above MA Index to confirm the strength of bullish trends. A consistently high index value can indicate strong bullish momentum, supporting decisions to hold or enter long positions.
- Divergence Detection: Monitor for divergences where the price might be making new highs, but the index shows a declining trend in closes above the moving average. This could signal a weakening trend and a potential reversal.
- Combine with Other Indicators: Pair this index with volume indicators or other momentum oscillators to corroborate the signals and strengthen trade setups.
- Adjust Settings for Market Conditions: Modify the period settings for the index and the moving average to align with different market conditions. Shorter periods may be more responsive to price changes, while longer periods might smooth out volatility and provide a clearer trend direction.
- Backtesting: Validate the effectiveness of the indicator in historical data. Experiment with different settings and types of moving averages to find the most effective combination for your trading strategy.
Parameters
Period
- Type: int
- Description: Specifies the number of bars over which the index is calculated. This period affects how the indicator averages the instances of closes above the moving average, providing insight into the duration of bullish trends.
- Default Value: 5
- Valid Values: Any positive integer, allowing customization to suit different analysis needs and trading strategies.
Moving Average Type
- Type: TdjMovingAverageProperties.MovingAverageType
- Description: Allows the trader to select the type of moving average used in the calculation. This flexibility lets traders match the moving average to their trading style and the characteristics of the market they are analyzing.
- Default Value: Ema (Exponential Moving Average)
- Options: Ema, Dema, Sma, providing versatility in how the moving average is calculated and applied in market analysis.
MA Period
- Type: int
- Description: Determines the number of bars used to calculate the moving average. This setting influences how closely the moving average follows price action, affecting the sensitivity of the indicator to recent market movements.
- Default Value: 15
- Valid Values: Any positive integer, which can be adjusted to reflect different market conditions and trading objectives.
Plots
- Value
- Type: Plot
- Color: DeepSkyBlue
- Description: Represents the calculated index value, showing the proportion of bars where the closing price is above the moving average within the specified period. This plot provides a visual representation of the trend's strength, with higher values indicating a stronger bullish trend.