Up Down Candle Index
Description
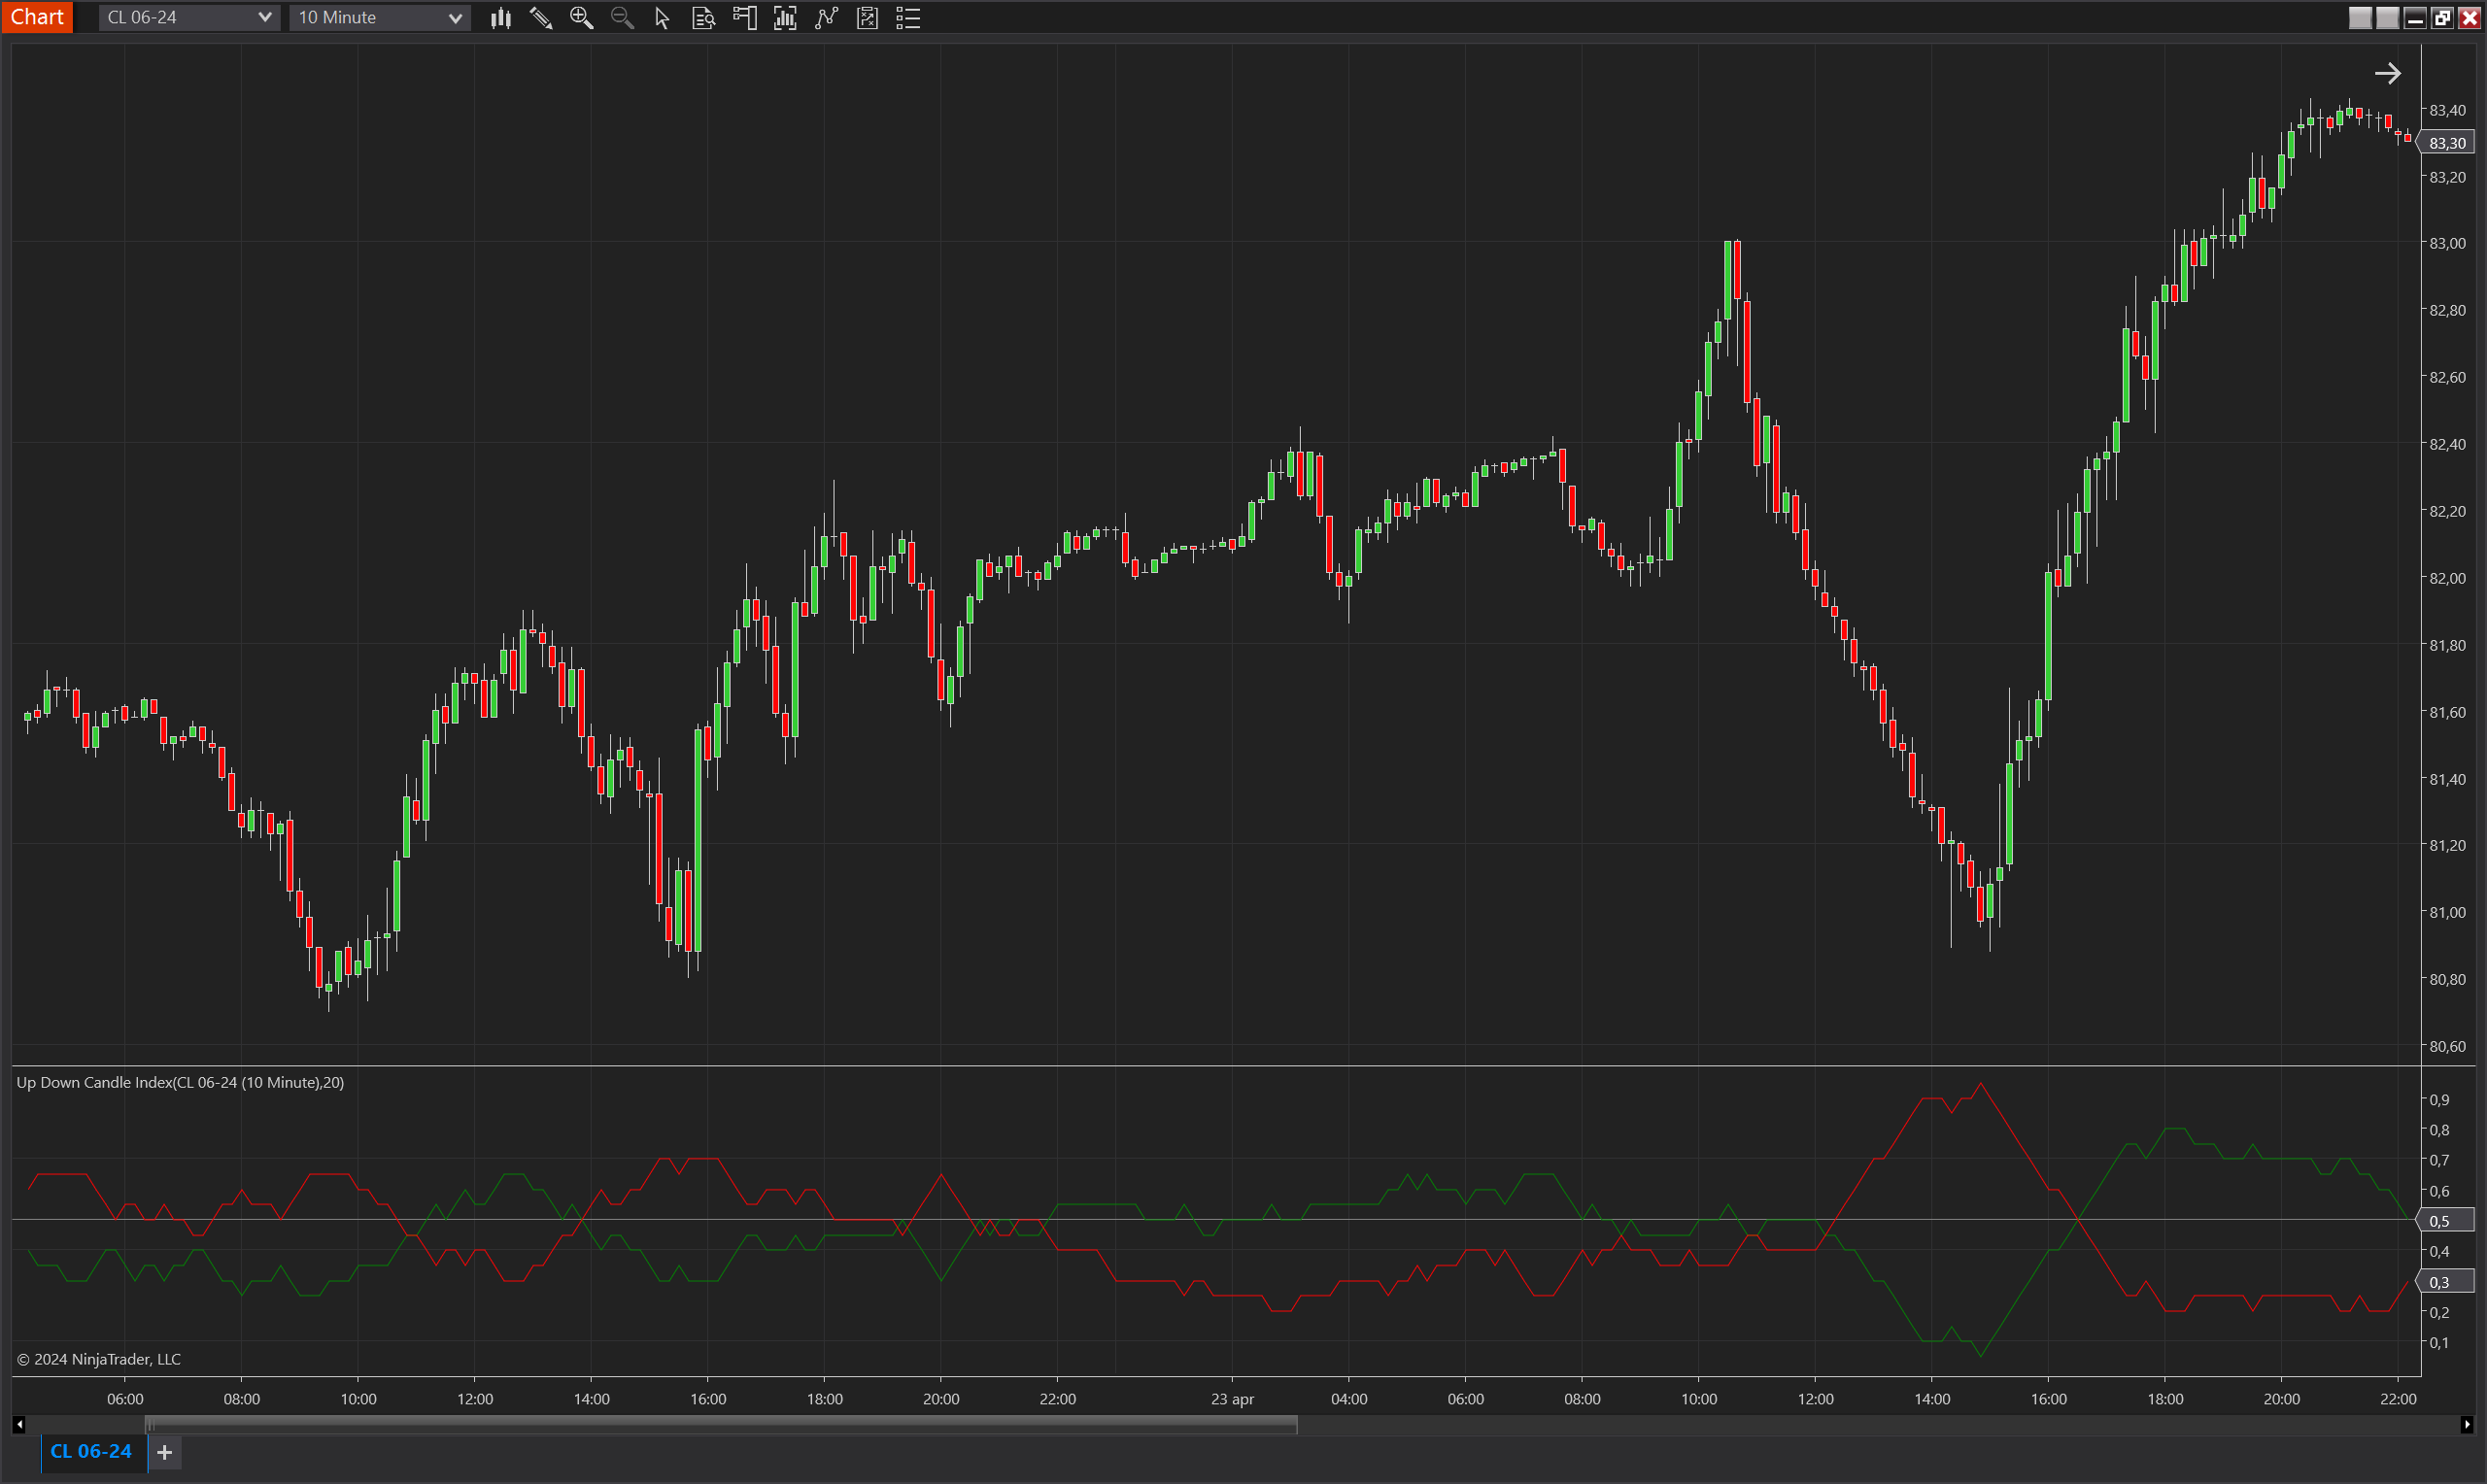
The Up Down Candle Index is a dynamic indicator designed for NinjaTrader 8 that quantitatively assesses the frequency of bullish (up) and bearish (down) candles over a specified period. This indicator tracks the count of candles closing higher or lower than their opening prices, providing a clear metric of market sentiment and momentum.
Key Features
- Dual Candle Tracking: This indicator separately calculates the occurrences of up and down candles within a given period, offering a comprehensive view of market dynamics.
- Proportional Index Calculation: Computes indexes for both up and down candles as a proportion of the total number of candles over the set period, facilitating a balanced analysis of bullish vs. bearish activity.
- Customizable Period: Allows traders to set the period for analysis, which adjusts the sensitivity of the indicator to recent market movements.
- Visual Plots: Features separate plots for up and down candle indexes, colored in green and red, respectively. This visual differentiation aids in quickly identifying trends in bullish and bearish pressures.
Tips for Implementation
- Market Sentiment Analysis: Utilize the index to gauge overall market sentiment. A higher proportion of up candles can indicate bullish sentiment, while a predominance of down candles might suggest bearish sentiment.
- Trend Confirmation: Employ the index to confirm trends indicated by other analysis techniques. For instance, a rising trend in up candles might confirm bullish signals from moving averages or momentum oscillators.
- Period Adjustment: Tailor the period parameter to fit the instrument's volatility and your trading style. Shorter periods may be more responsive to sudden market changes, while longer periods could provide a smoother and more stable signal.
- Combination with Other Indicators: Combine the Up Down Candle Index with volume indicators to validate the strength behind up or down candles. Higher volume associated with directional candles could reinforce the reliability of the trend.
- Threshold Analysis: Use the threshold line to identify significant changes in the index's behavior, such as unusually high values that could predict potential reversals or accelerations in price movement.
Parameters
Period
- Type: int
- Description: Sets the number of bars over which the index calculates the occurrences of up and down candles. Adjusting this parameter alters the sensitivity and responsiveness of the indicator.
- Default Value: 10
- Valid Values: Any positive integer, allowing customization to match different trading strategies and market conditions.
Plots
ValueUp
- Type: Plot
- Color: Green
- Description: Represents the index of up candles over the defined period, showing the proportion of bars that closed higher than their opening prices. This plot helps visualize bullish sentiment and momentum.
ValueDown
- Type: Plot
- Color: Red
- Description: Represents the index of down candles over the defined period, showing the proportion of bars that closed lower than their opening prices. This plot helps visualize bearish sentiment and momentum.
Threshold
- Type: Line
- Color: Gray
- Description: A horizontal line, often set at a mid-point value like 0.5, used to highlight significant levels where the frequency of up or down candles becomes notably dominant. This line serves as a visual aid for detecting shifts in market dynamics.