Close Lower Percent Index
Description
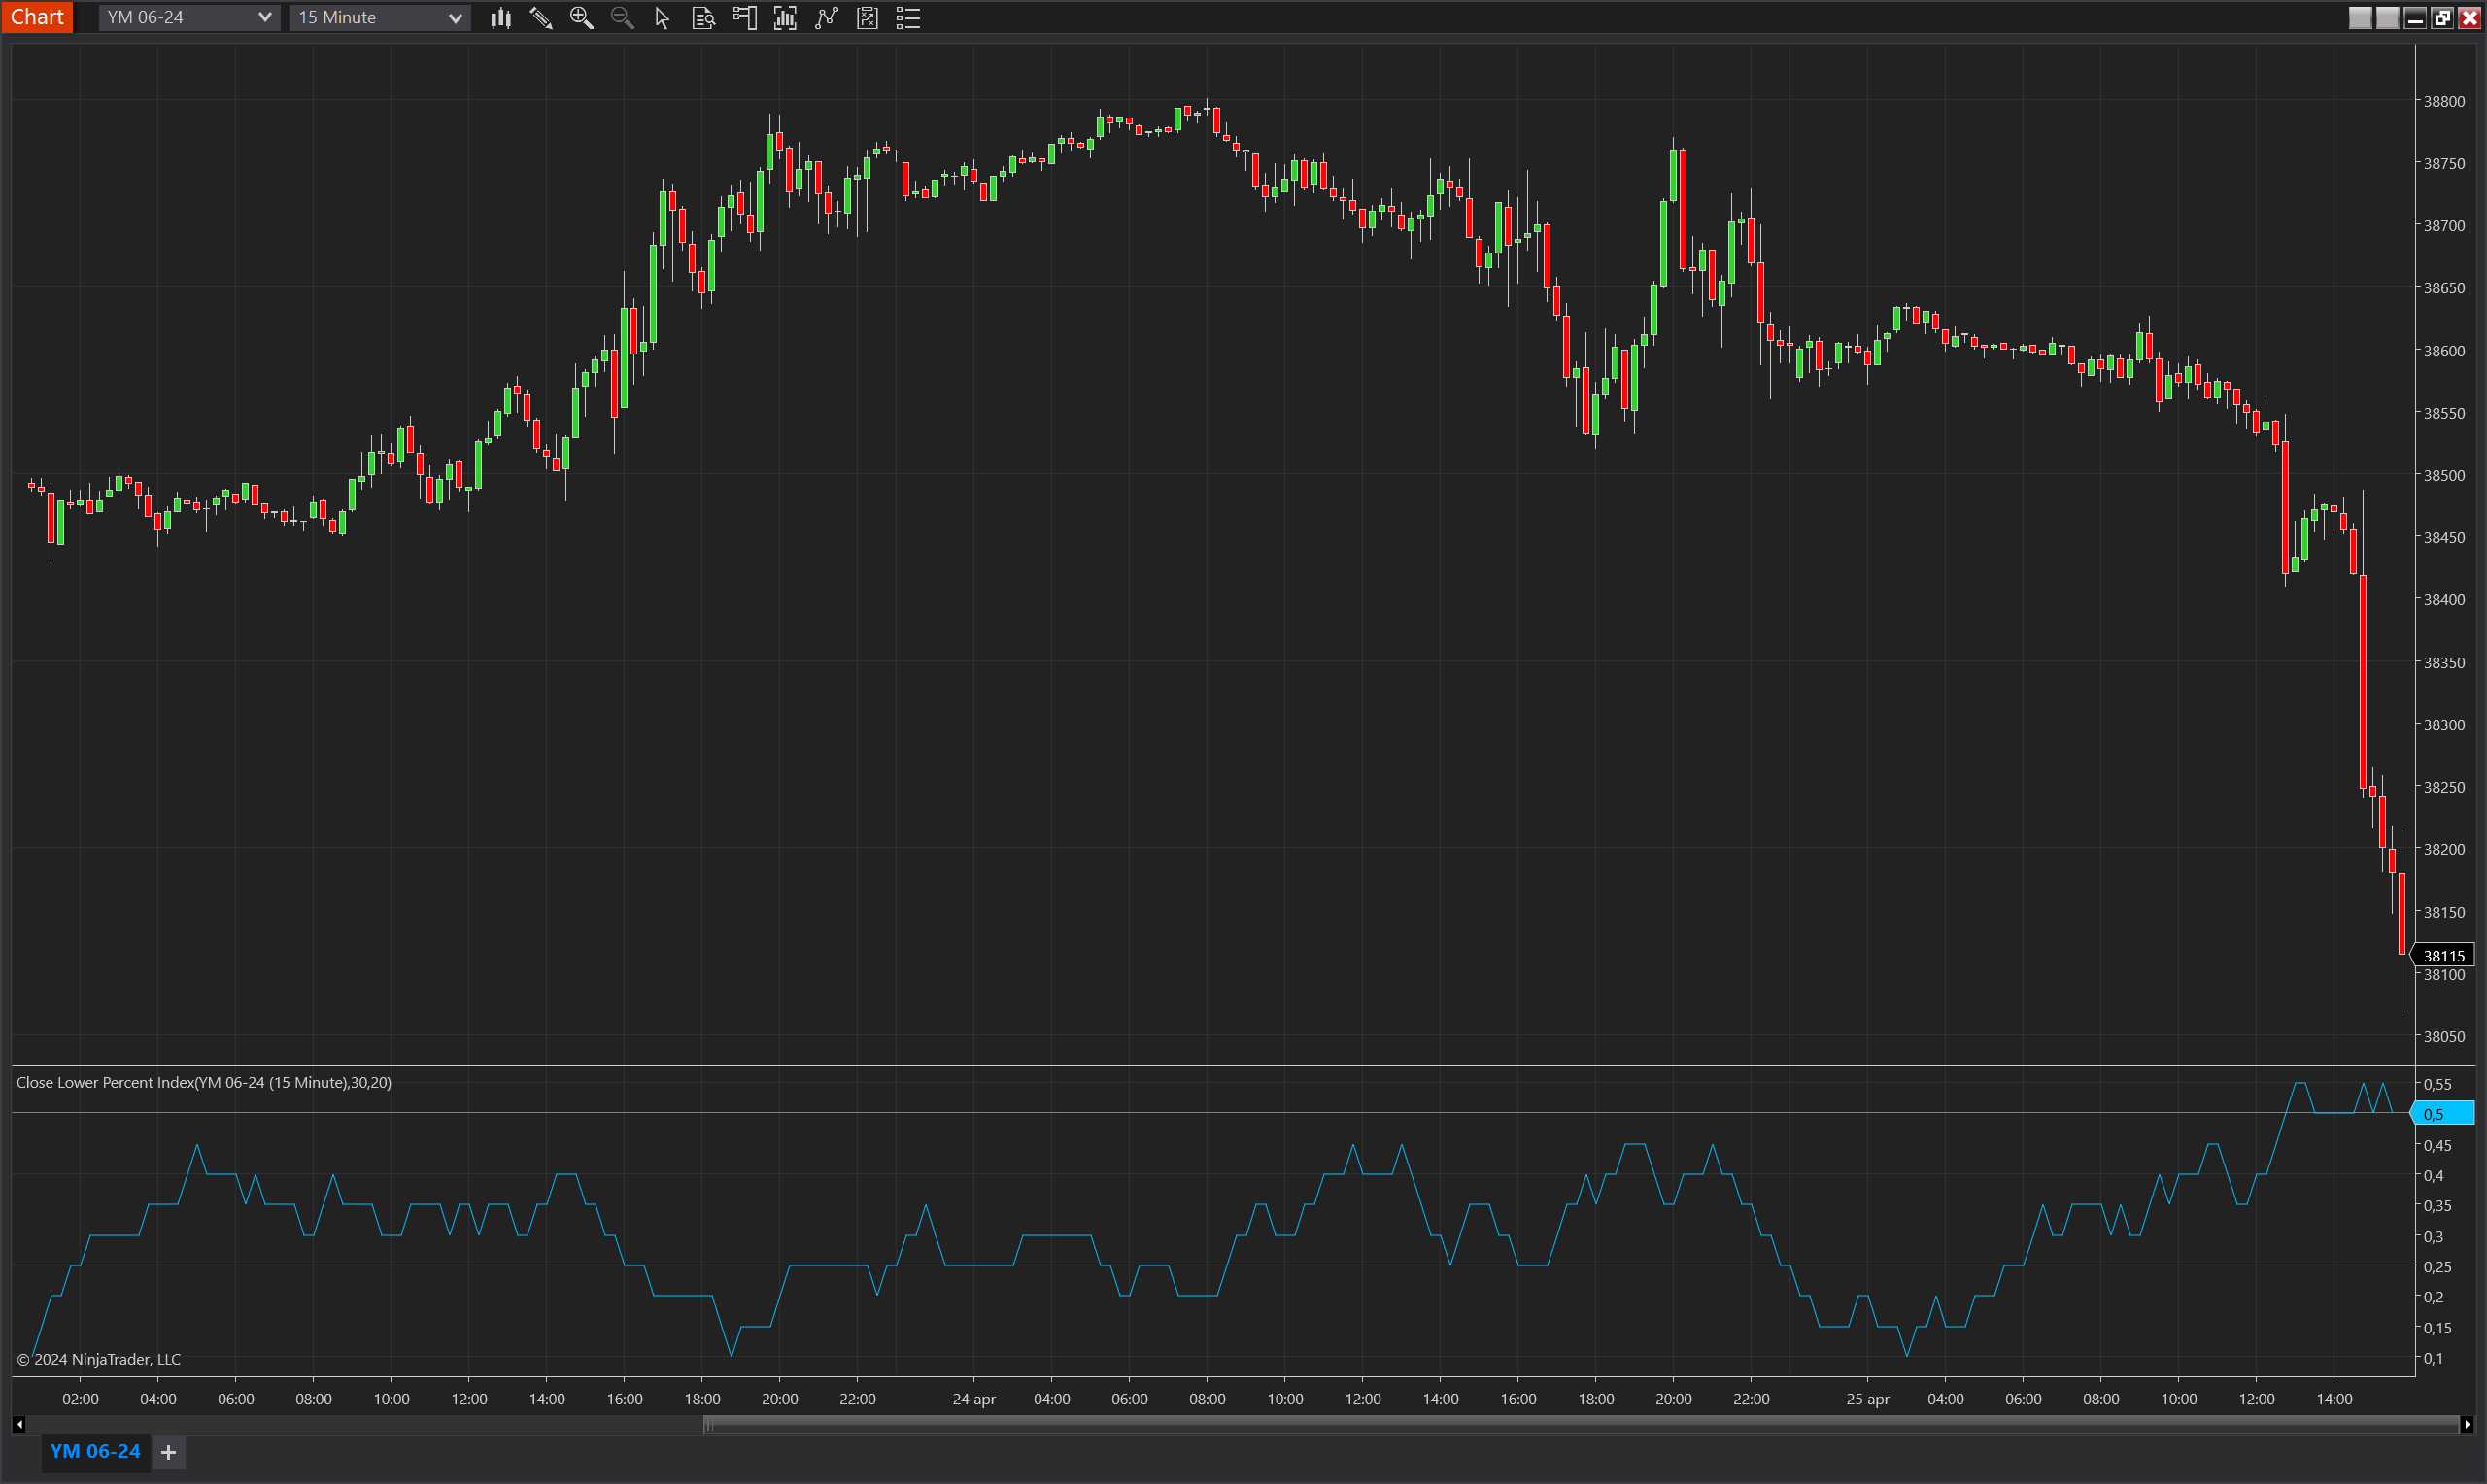
The Close Lower Percent Index is an innovative indicator designed for NinjaTrader 8, aimed at assessing the tendency of price bars to close within a specific lower percentage of their range. This indicator calculates an index that quantifies how frequently the close of a bar occurs in the lower portion of its total range, defined as a percentage of that range. It serves as a metric for bearish sentiment within individual bars, offering insights into potential selling pressure or bearish exhaustion in the market.
Key Features
- Percentage-Based Close Analysis: The indicator measures the occurrence of bar closes in the lower percentage of their range, providing a precise metric to gauge bearish strength or weakness.
- Adjustable Period and Percentage: Users can set the period over which the index is calculated and the percentage that defines the "lower" portion of the bar range. This flexibility allows the indicator to be fine-tuned for different trading styles and market conditions.
- Index Calculation: It compiles an index value based on the proportion of bars closing in the defined lower range across the specified period, illustrating the consistency of price closing towards the lower end of its daily range.
- Visual Display: Features a plot of the index values against a threshold line, enabling easy visualization of the trend in bearish closing positions.
Tips for Implementation
- Identify Bearish Sentiment: Use the indicator to spot periods where an unusually high number of bars close in the lower segment of their range, which could indicate increased bearish sentiment or potential downward momentum.
- Combination with Volume Indicators: Pair the Close Lower Percent Index with volume indicators to confirm whether the closes in the lower range are accompanied by high trading volume, which can validate the bearish signals.
- Optimize Settings for Volatility: Adjust the percentage parameter to account for different levels of market volatility. In more volatile markets, a lower percentage might be more indicative of significant bearish sentiment.
- Threshold Analysis: Utilize the threshold line to determine significant levels where the index value suggests a change in market conditions. Values persistently below the threshold might indicate bearish exhaustion or a potential reversal if accompanied by other confirming signals.
- Backtesting: As with any trading tool, backtesting the Close Lower Percent Index under historical market conditions is crucial to understanding its effectiveness and reliability before integrating it into a live trading strategy.
This indicator is especially useful for traders who focus on intraday price movements and are looking to capture trends or reversals based on closing price positions within the daily trading range.
Parameters
Period
- Type: int
- Description: Determines the number of bars over which the index is calculated. This setting influences how the indicator aggregates instances where the close is within the defined lower percentage of the bar range, providing insights into the duration and consistency of bearish sentiment.
- Default Value: 5
- Valid Values: Any positive integer, allowing traders to customize the sensitivity and reflectivity of the indicator to their trading strategies.
Percentage
- Type: int
- Description: Specifies the percentage of the bar range that defines the "lower" section where the close must occur for the index to increase. This percentage sets the boundary for what is considered the lower part of the bar for this indicator's calculations.
- Default Value: 30
- Valid Values: Any integer from 0 to 100, providing flexibility to define how narrowly or broadly the "lower" section is considered within the bar's total range.
Plots
Value
- Type: Plot
- Color: DeepSkyBlue
- Description: Displays the calculated index value, representing the proportion of bars closing within the lower percentage of their range as defined by the indicator's settings. This plot visually represents the frequency of bearish closes relative to the total bars analyzed over the specified period.
Threshold
- Type: Line
- Color: Gray
- Description: A threshold line is typically set at a critical value (like 0.5) to help identify when the index value suggests that a significant portion of bars are closing in the lower part of their range, potentially indicating strong bearish sentiment or market exhaustion.