Close Below MA Index
Description
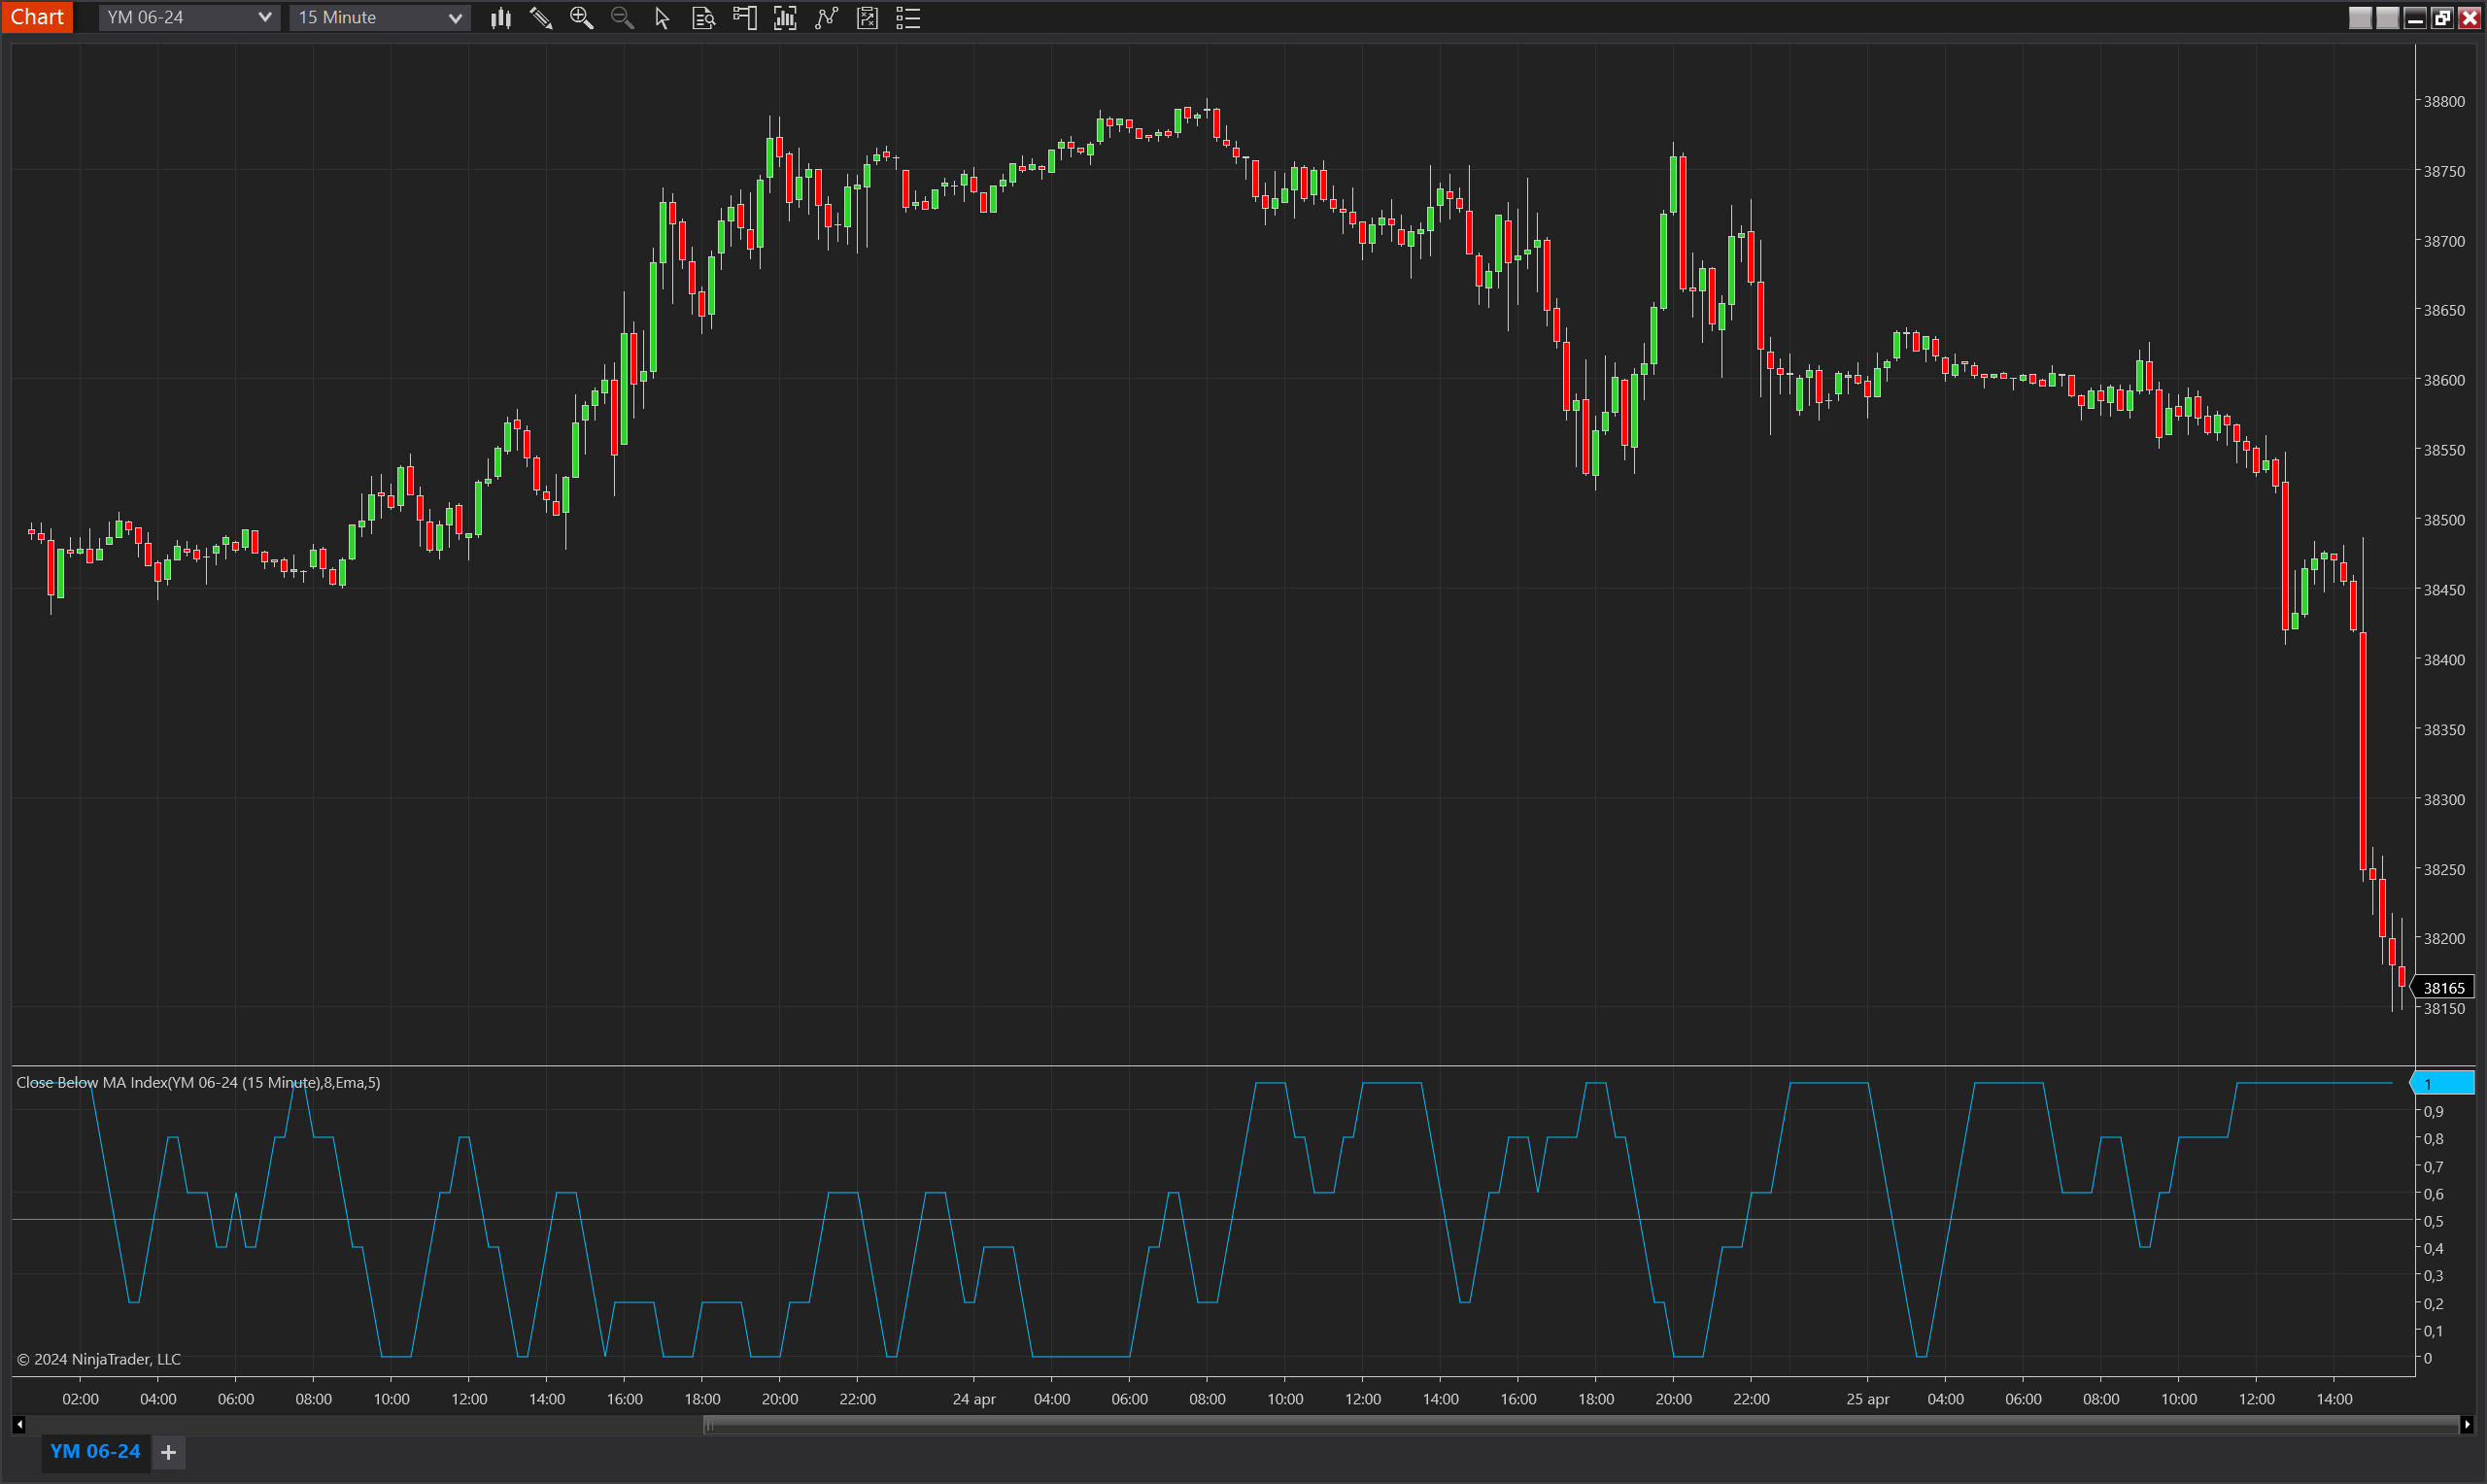
The Close Below MA Index is an advanced analytical tool designed for NinjaTrader 8 that measures the frequency with which the closing price of a bar finishes below a selected moving average. This indicator quantifies bearish persistence over a specified period, providing valuable insights into downward market trends and potential bearish exhaustion. By calculating how often the close remains below the moving average, it offers a clear view of downward momentum or potential strengthening of bearish trends.
Key Features
- Support for Multiple Moving Averages: The indicator is compatible with various types of moving averages including Exponential Moving Average (EMA), Double Exponential Moving Average (DEMA), and Simple Moving Average (SMA). This allows traders to choose the moving average that best aligns with their trading strategy and market analysis approach.
- Index Calculation: The indicator computes an index value based on the proportion of bars closing below the moving average relative to the total bars over the designated period. This provides a numerical measure of the strength of bearish trends.
- Customizable Parameters: Traders can adjust the period for the moving average and the index calculation, tailoring the sensitivity and responsiveness of the indicator to their specific requirements.
- Visual Representation: Features a plot of the index value, aiding traders in visualizing the persistence of bearish trends and making it easier to identify changes in trend dynamics.
Tips for Implementation
- Trend Confirmation: Utilize the Close Below MA Index to confirm the strength of bearish trends. A consistently high index value can indicate strong bearish momentum, supporting decisions to hold or enter short positions.
- Detection of Trend Reversals: Look for divergences where the price might be making new lows, but the index shows a declining trend in closes below the moving average. This could indicate a weakening trend and a potential reversal.
- Integration with Other Indicators: Combine this index with volume indicators or other momentum oscillators to confirm signals derived from price movements below the moving average and refine entry and exit points.
- Adjustment of Settings for Market Conditions: Modify the period settings for the index and the moving average to match different market conditions. Shorter periods may make the indicator more responsive to price changes, while longer periods might help smooth out volatility and provide a clearer picture of the trend direction.
- Backtesting: Always backtest the indicator using historical data to validate its effectiveness across different market environments and to optimize its settings for your trading strategy.
This indicator is an essential tool for traders focusing on bearish market strategies, offering a detailed perspective on the duration and strength of bearish trends within the trading environment.
Parameters
Period
- Type: int
- Description: Determines the number of bars over which the index is calculated. This setting influences the aggregation of instances where the close is below the moving average, providing insights into the duration and consistency of bearish trends.
- Default Value: 5
- Valid Values: Any positive integer, allowing traders to customize the sensitivity and reflectivity of the indicator according to their trading strategies.
Moving Average Type
- Type: TdjMovingAverageProperties.MovingAverageType
- Description: Selects the type of moving average used in the calculation. This choice allows traders to match the moving average to their analytical needs, optimizing the indicator for different market behaviors.
- Default Value: Ema (Exponential Moving Average)
- Options: Ema, Dema, Sma, providing flexibility in how the moving average is calculated and applied.
MA Period
- Type: int
- Description: Specifies the number of bars used to calculate the moving average. This parameter affects how closely the moving average follows the price action, impacting the sensitivity of the indicator to recent price movements.
- Default Value: 15
- Valid Values: Any positive integer, adaptable to different market conditions and trading objectives.
Plots
Value
- Type: Plot
- Color: DeepSkyBlue
- Description: Represents the calculated index value, showing the proportion of bars where the closing price is below the moving average within the specified period. This plot visualizes the bearish trend strength, with higher values indicating stronger bearish persistence.