Bar Body Range Within Average Index
Description
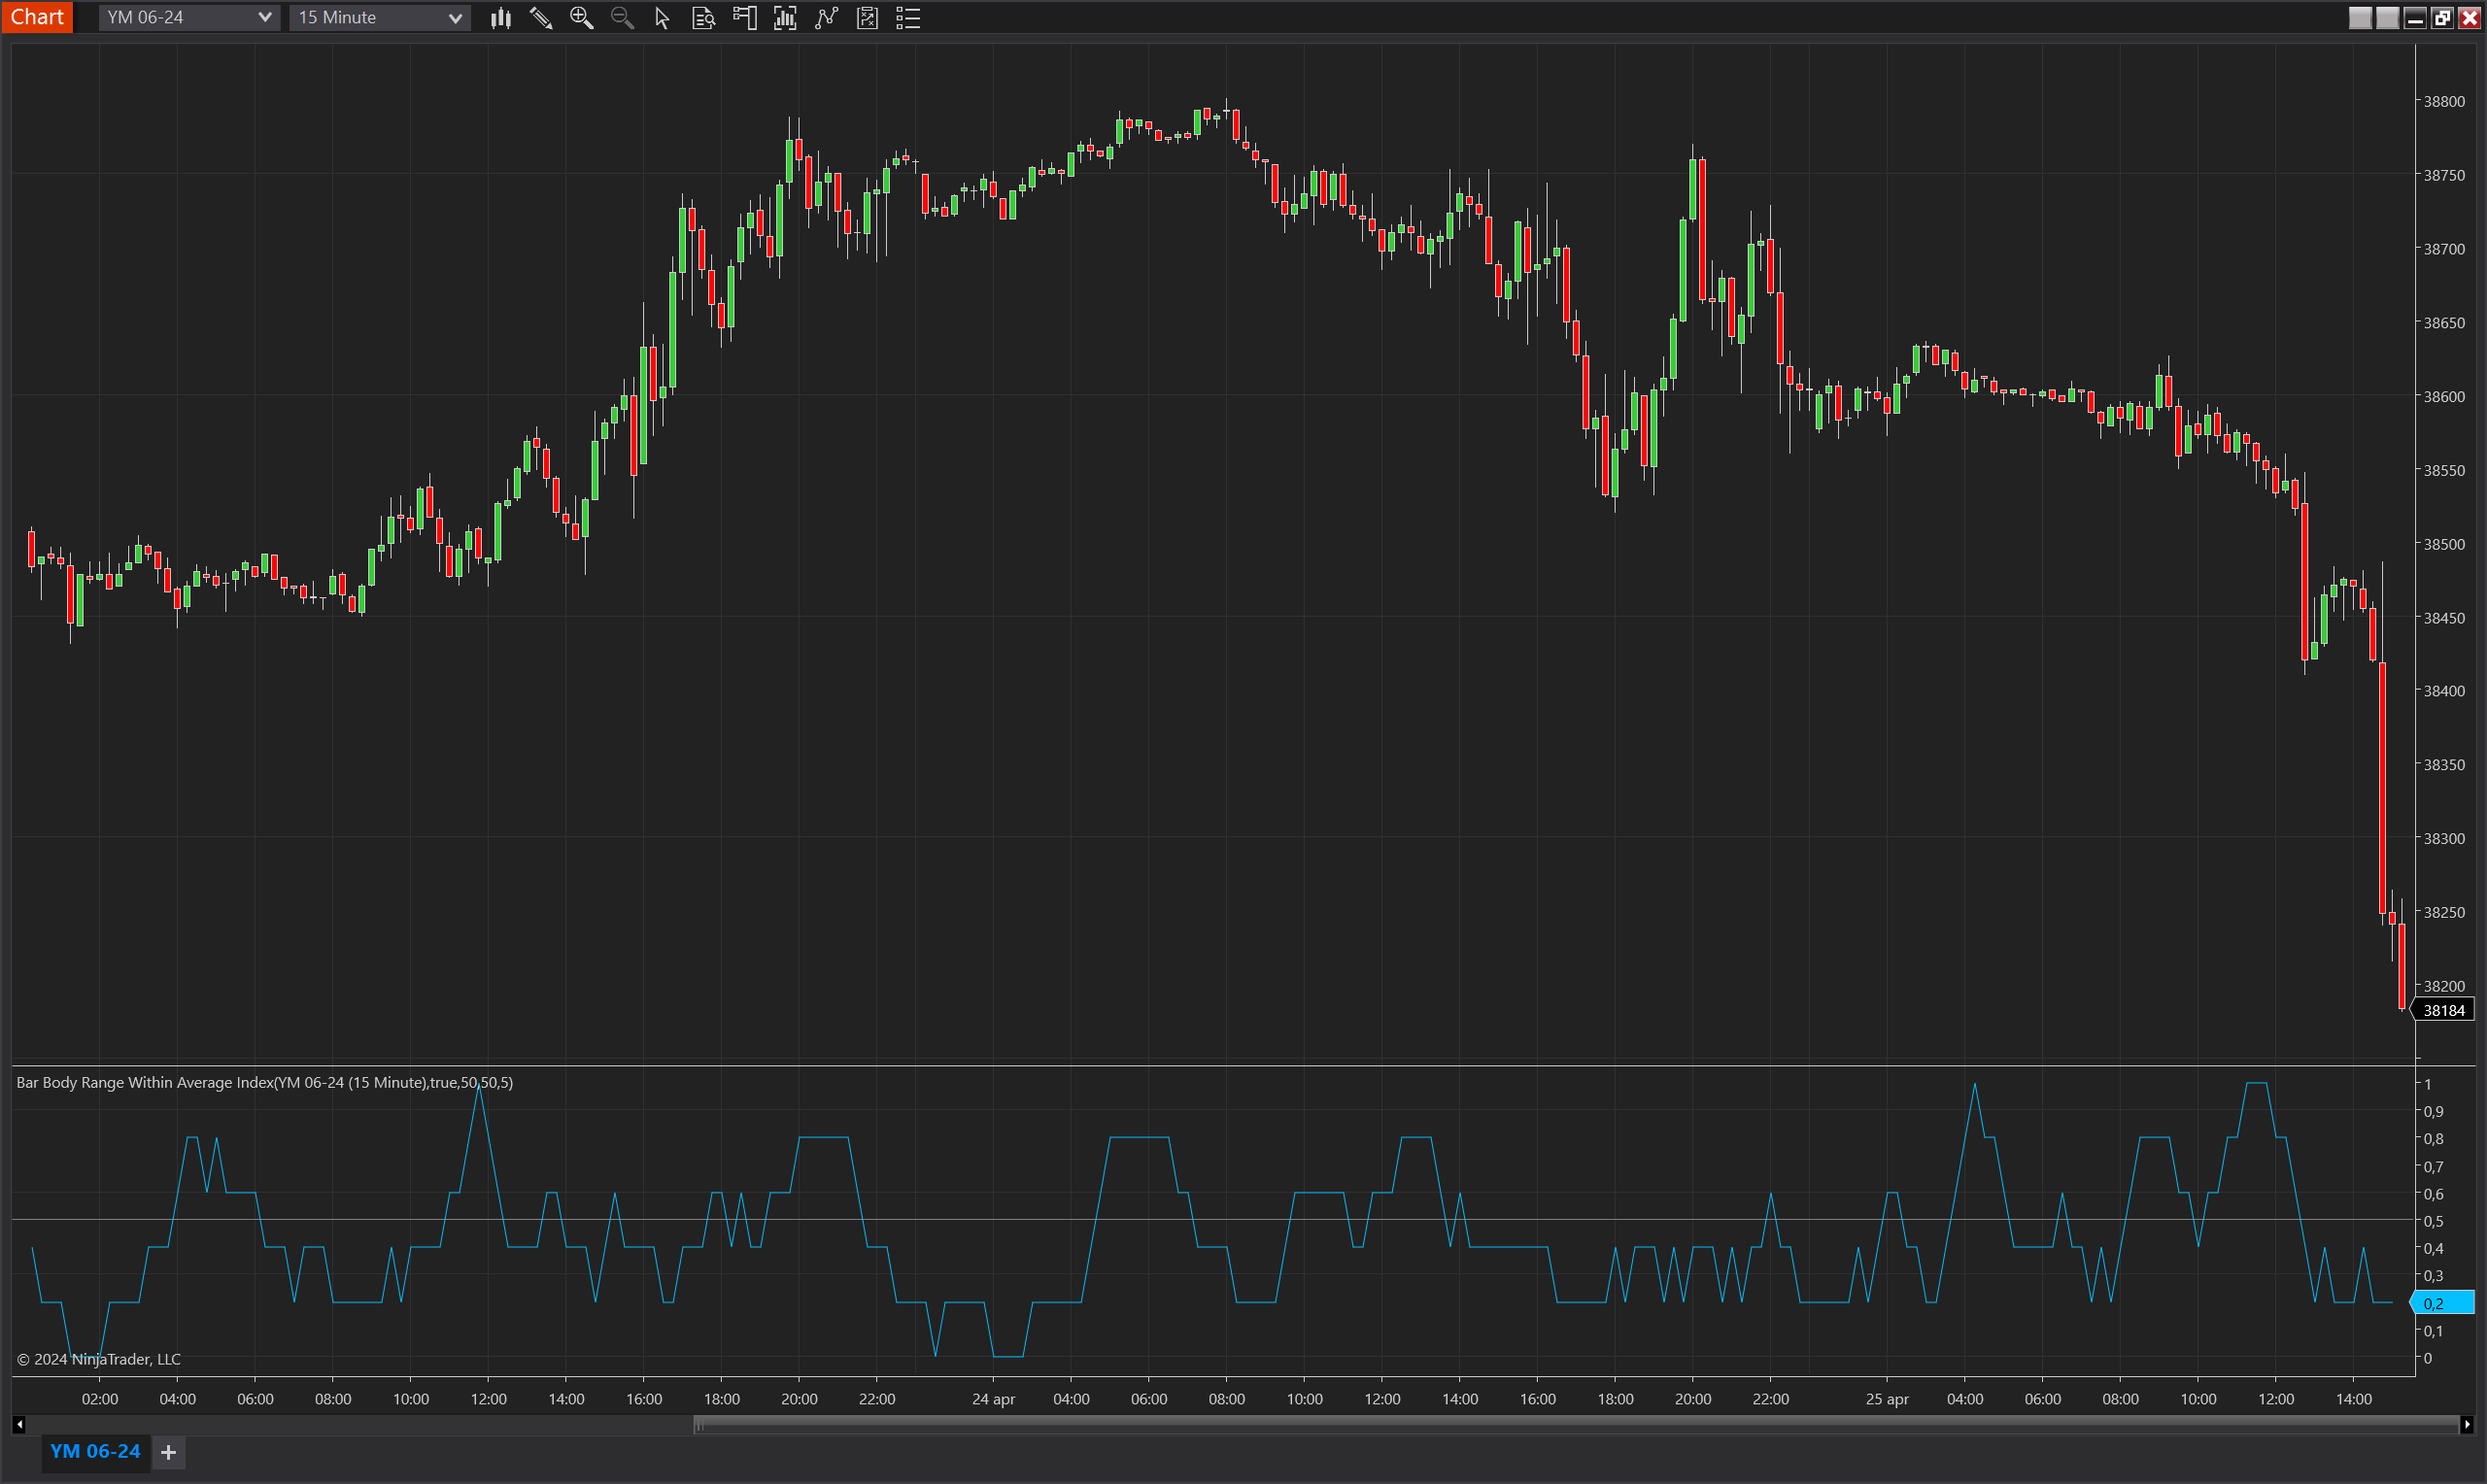
The Bar Body Range Within Average Index is a nuanced indicator for NinjaTrader 8 that measures the consistency of bar sizes relative to their average over a specified period. This indicator assesses whether the range (difference between the open and close) of each bar falls within a predefined percentage deviation from the average range of previous bars. It's particularly useful for identifying periods of unusual price behavior by comparing current bar sizes against historical averages, signaling potential volatility or calm in market conditions.
The indicator can be set to compare only the most recent bar against the average or all bars within the set period, providing flexibility in monitoring market dynamics. This functionality makes it a valuable tool for traders who are looking to gauge market sentiment and adjust their strategies based on the relative stability or volatility indicated by the bar sizes.
Key Features
- Average Range Comparison: Calculates the average bar size over a designated period and determines if current or historical bars fall within specified deviations from this average.
- Flexible Deviation Settings: Allows traders to set minimum and maximum percentage deviations for the bar sizes from their average, providing a tailored analytical approach to different market conditions.
- Selective Comparison Option: Offers the ability to compare only the latest bar against the historical average or all bars within the period, enhancing its adaptability to different trading styles.
- Visualization and Threshold Line: Includes a plot of the index values and a threshold line, aiding in quick visual assessments of market behavior relative to the average bar size.
Tips for Implementation
- Volatility Analysis: Use the indicator to understand periods of increased or decreased volatility. A higher number of bars outside the average range can indicate increased volatility, useful for setting stop-losses or preparing for breakout strategies.
- Combination with Other Indicators: Pair with volume indicators or volatility measures like the Average True Range (ATR) to confirm signals derived from bar size anomalies.
- Customize Period and Deviation Percentages: Adjust the period for calculating the average and the deviation percentages to match the volatility and typical behavior of the asset being traded.
- Backtesting for Optimization: Backtest the indicator under various settings and market conditions to determine the most effective parameters for your trading strategy.
- Real-time Adjustment: In fast-moving markets, consider reducing the period to make the indicator more responsive to recent changes, or increase it in more stable conditions to filter
Parameters
Period
- Type: int
- Description: Determines the number of bars used to calculate the average bar range. This setting influences how the indicator averages bar sizes and identifies deviations, impacting its sensitivity to recent price movements.
- Default Value: 5
- Valid Values: Any positive integer, allowing customization for different trading styles and sensitivity preferences.
Min Bar Size Deviation Percent
- Type: int
- Description: Specifies the minimum percentage deviation from the average bar size that is considered normal. This parameter sets the lower threshold for what constitutes a significant deviation in bar size.
- Default Value: 50
- Valid Values: Any non-negative integer, providing flexibility in defining what is considered a notable decrease in bar size relative to the average.
Max Bar Size Deviation Percent
- Type: int
- Description: Defines the maximum percentage deviation from the average bar size that is considered normal. This setting establishes the upper threshold for what is considered a significant increase in bar size.
- Default Value: 50
- Valid Values: Any non-negative integer, allowing users to set a customized range for identifying significant increases in bar size.
Compare Only New Bar
- Type: bool
- Description: When set to true, the indicator compares only the most recent bar to the historical average. If false, it compares all bars within the specified period to the average. This option provides flexibility in how the indicator assesses market conditions.
- Default Value: false
- Options: true (Yes), false (No)
Plots
Value
- Type: Plot
- Color: DeepSkyBlue
- Description: Represents the index value calculated from the comparison of bar sizes to the average range. This plot shows the proportion of bars meeting the specified deviation criteria within the set period, providing a visual measure of how often bars significantly differ from the average.
Threshold
- Type: Line
- Color: Gray
- Description: A threshold line typically set at a critical value (like 0.5) to help visually identify when the proportion of bars deviating from the average range exceeds a certain level. This line can be used to signal when market conditions are becoming more volatile or stabilizing based on the bar size deviations.