New Low Index
Description
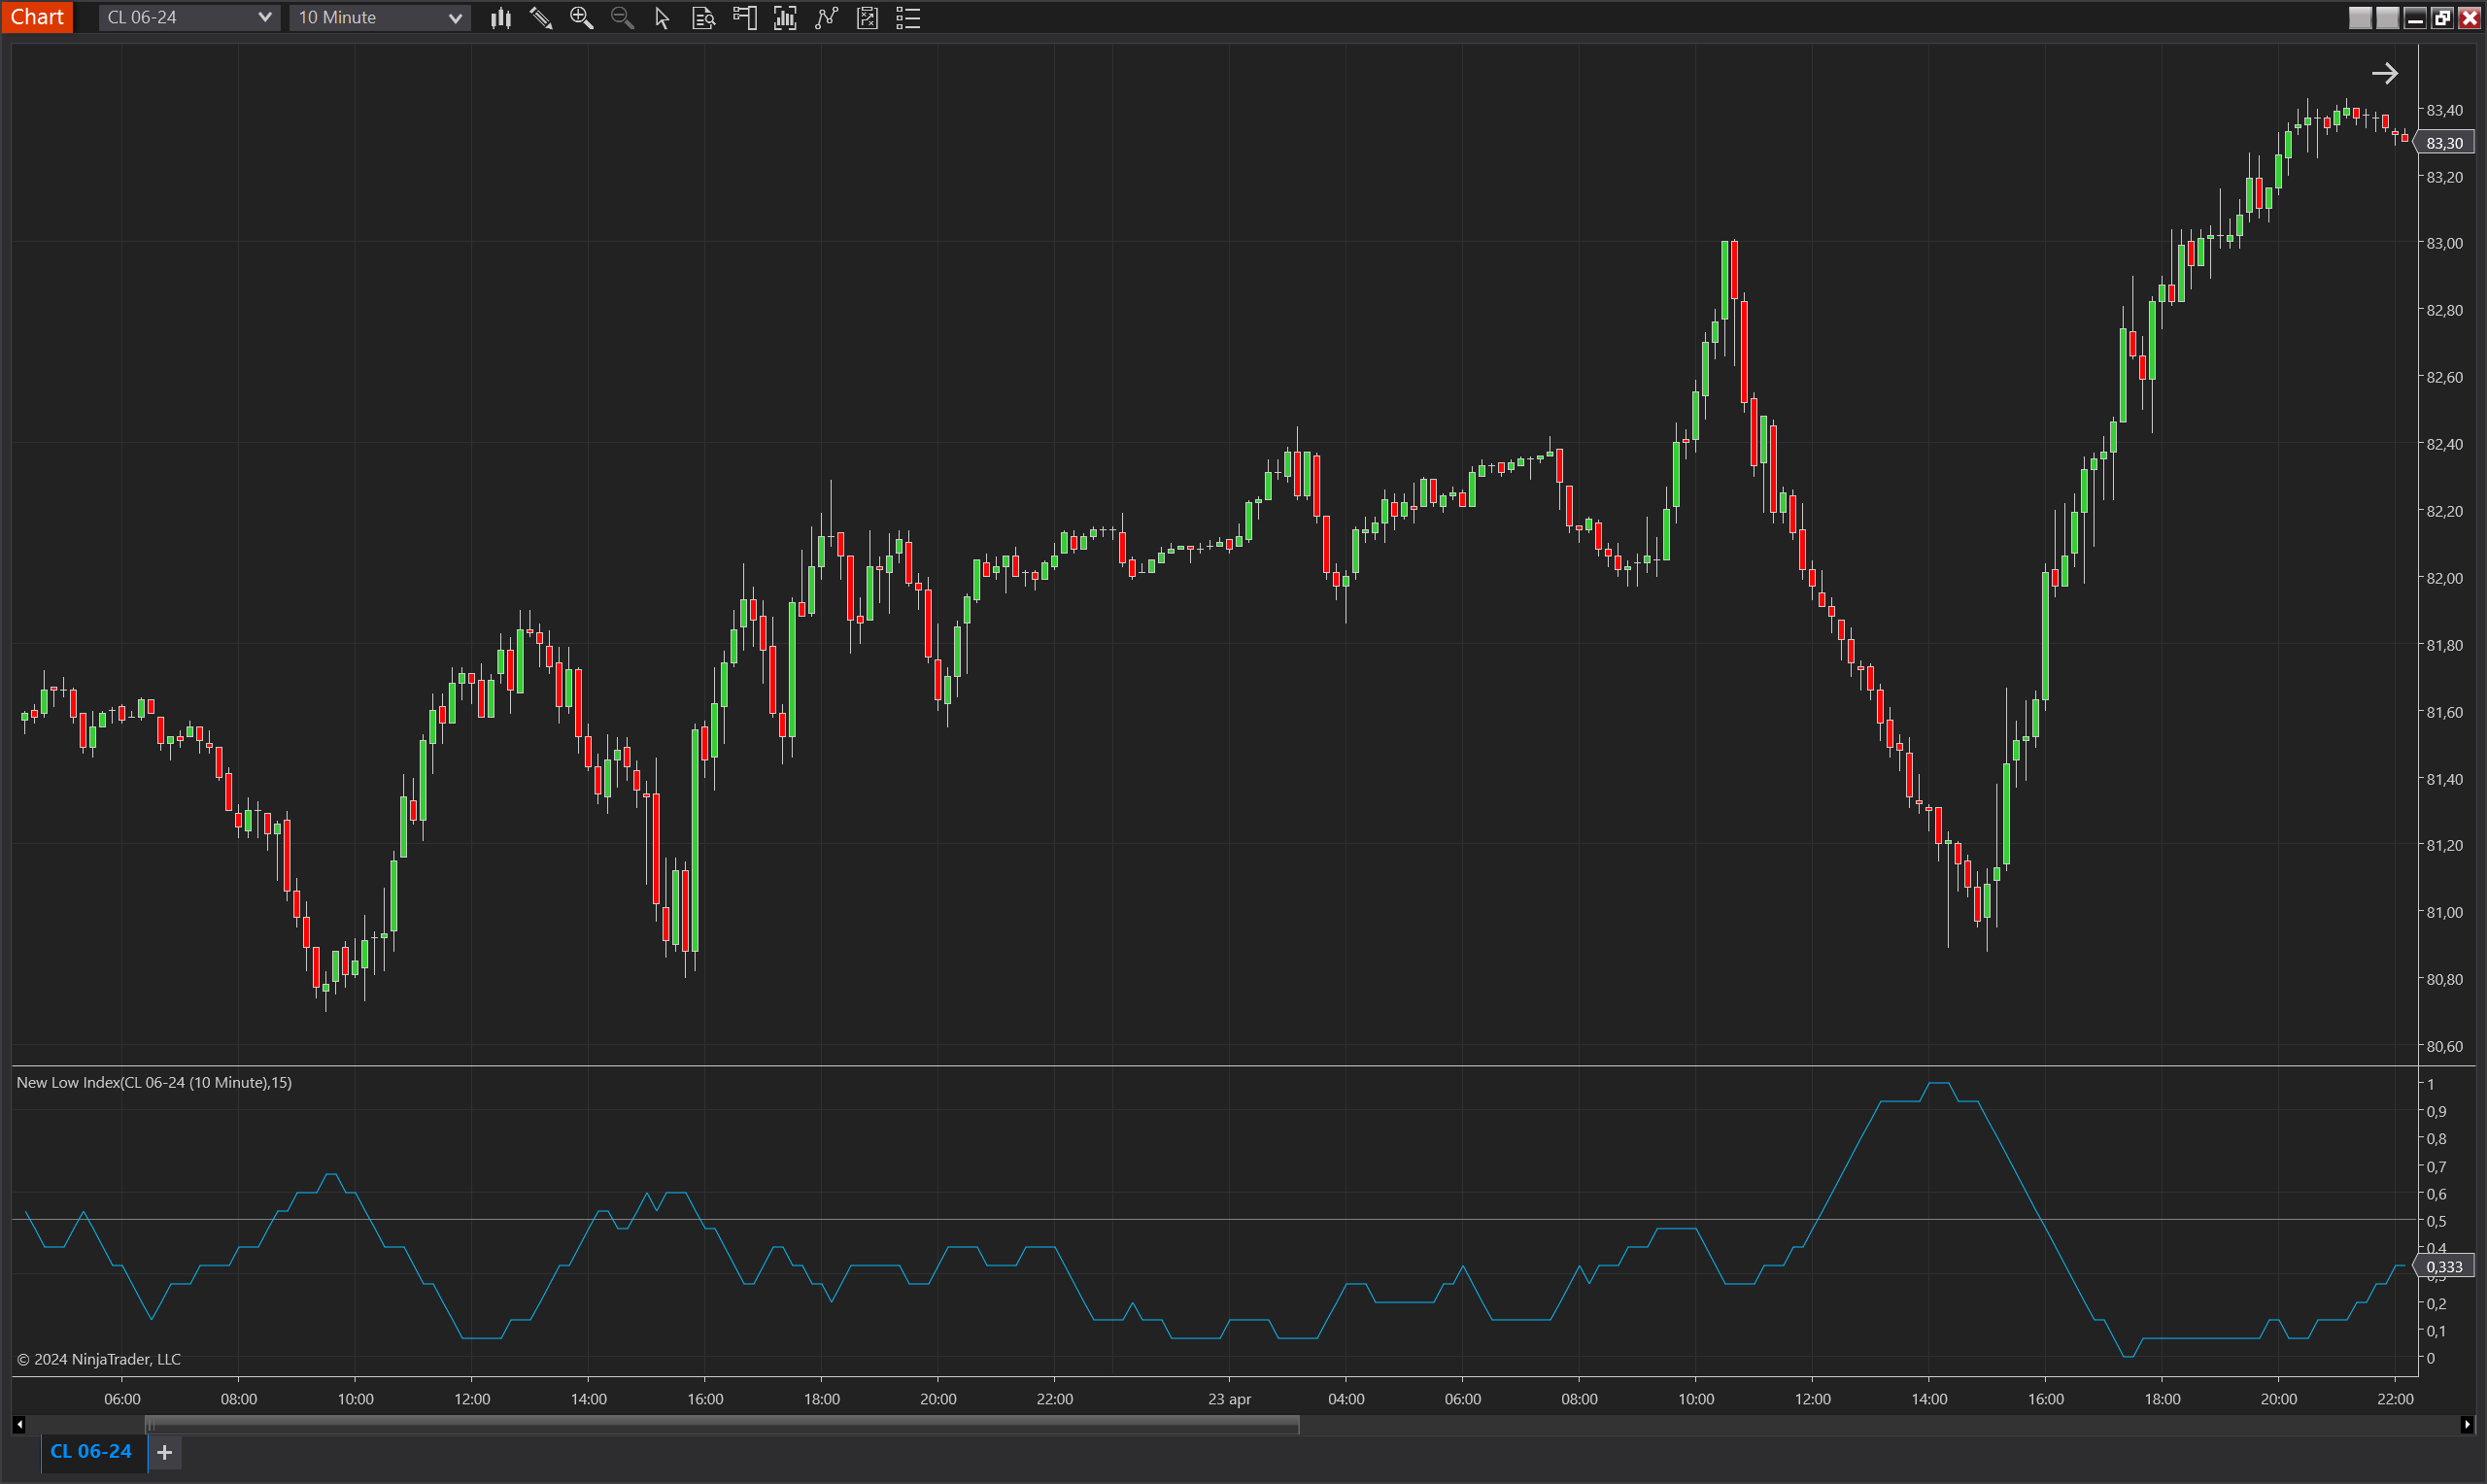
The New Low Index is a specialized indicator for NinjaTrader 8 that quantifies the occurrence of new lows being made relative to the previous bar. This index is crucial for detecting signs of bearish momentum and potential breakdowns in the market. By tracking consecutive decreases in the low prices of bars, the New Low Index provides insights into bearish market pressures and potential selling opportunities.
Key Features
- Low Comparison: The indicator specifically measures whether the current bar's low is lower than the low of the previous bar, directly assessing bearish progression.
- Index Calculation: Computes an index by aggregating the occurrences of new lows over a user-defined period, providing a ratio that represents the prevalence of new lows within that timeframe.
- Visual Tools: Includes a plot of the index values to visually represent the frequency of new lows, aiding traders in quickly assessing bearish momentum.
- Threshold Line: Incorporates a threshold line in the plot, allowing traders to set a benchmark for significant levels of new lows, which can be indicative of strong downward trends or market distress.
Tips for Implementation
- Bearish Strategy Enhancement: Use the index to enhance bearish trading strategies. An increasing index value can indicate growing bearish momentum, providing a reliable signal to consider entering short positions.
- Trend Confirmation: Monitor the index for sustained periods of high values to confirm the presence of a strong bearish trend.
- Combine with Volume Indicators: Pairing the New Low Index with volume indicators can strengthen the reliability of the signals. Increasing volume accompanying new lows can confirm the robustness of the bearish movement.
- Adjustable Sensitivity: Alter the period parameter to modify the sensitivity of the index. A shorter period may provide quicker responses to market changes, while a longer period could offer a smoother overview of market dynamics.
- Threshold Settings: Utilize the threshold line to define levels that historically signify important market movements. A consistent crossing of this line might signal a need for adjustments in trading positions or strategies.
Parameters
Period
- Type: int
- Description: Determines the number of bars over which the index is calculated. This parameter affects the smoothing and sensitivity of the index to new lows, allowing traders to tailor the indicator to different market conditions or personal trading preferences.
- Default Value: 5
- Valid Values: Any positive integer, providing flexibility for customization based on the trader's analytical needs.
Plots
Value
- Type: Plot
- Color: DeepSkyBlue
- Description: Displays the calculated index value, illustrating the proportion of bars that registered new lows over the specified period. This plot helps traders visualize the trend's strength and the frequency of bearish momentum.
Threshold
- Type: Line
- Color: Gray
- Description: A horizontal line set at a designated value (like 0.5), used to mark significant levels where the frequency of new lows becomes notably high or low. This line serves as a visual aid for identifying potential shifts in market dynamics.