Bar Above Below MA Index
Description
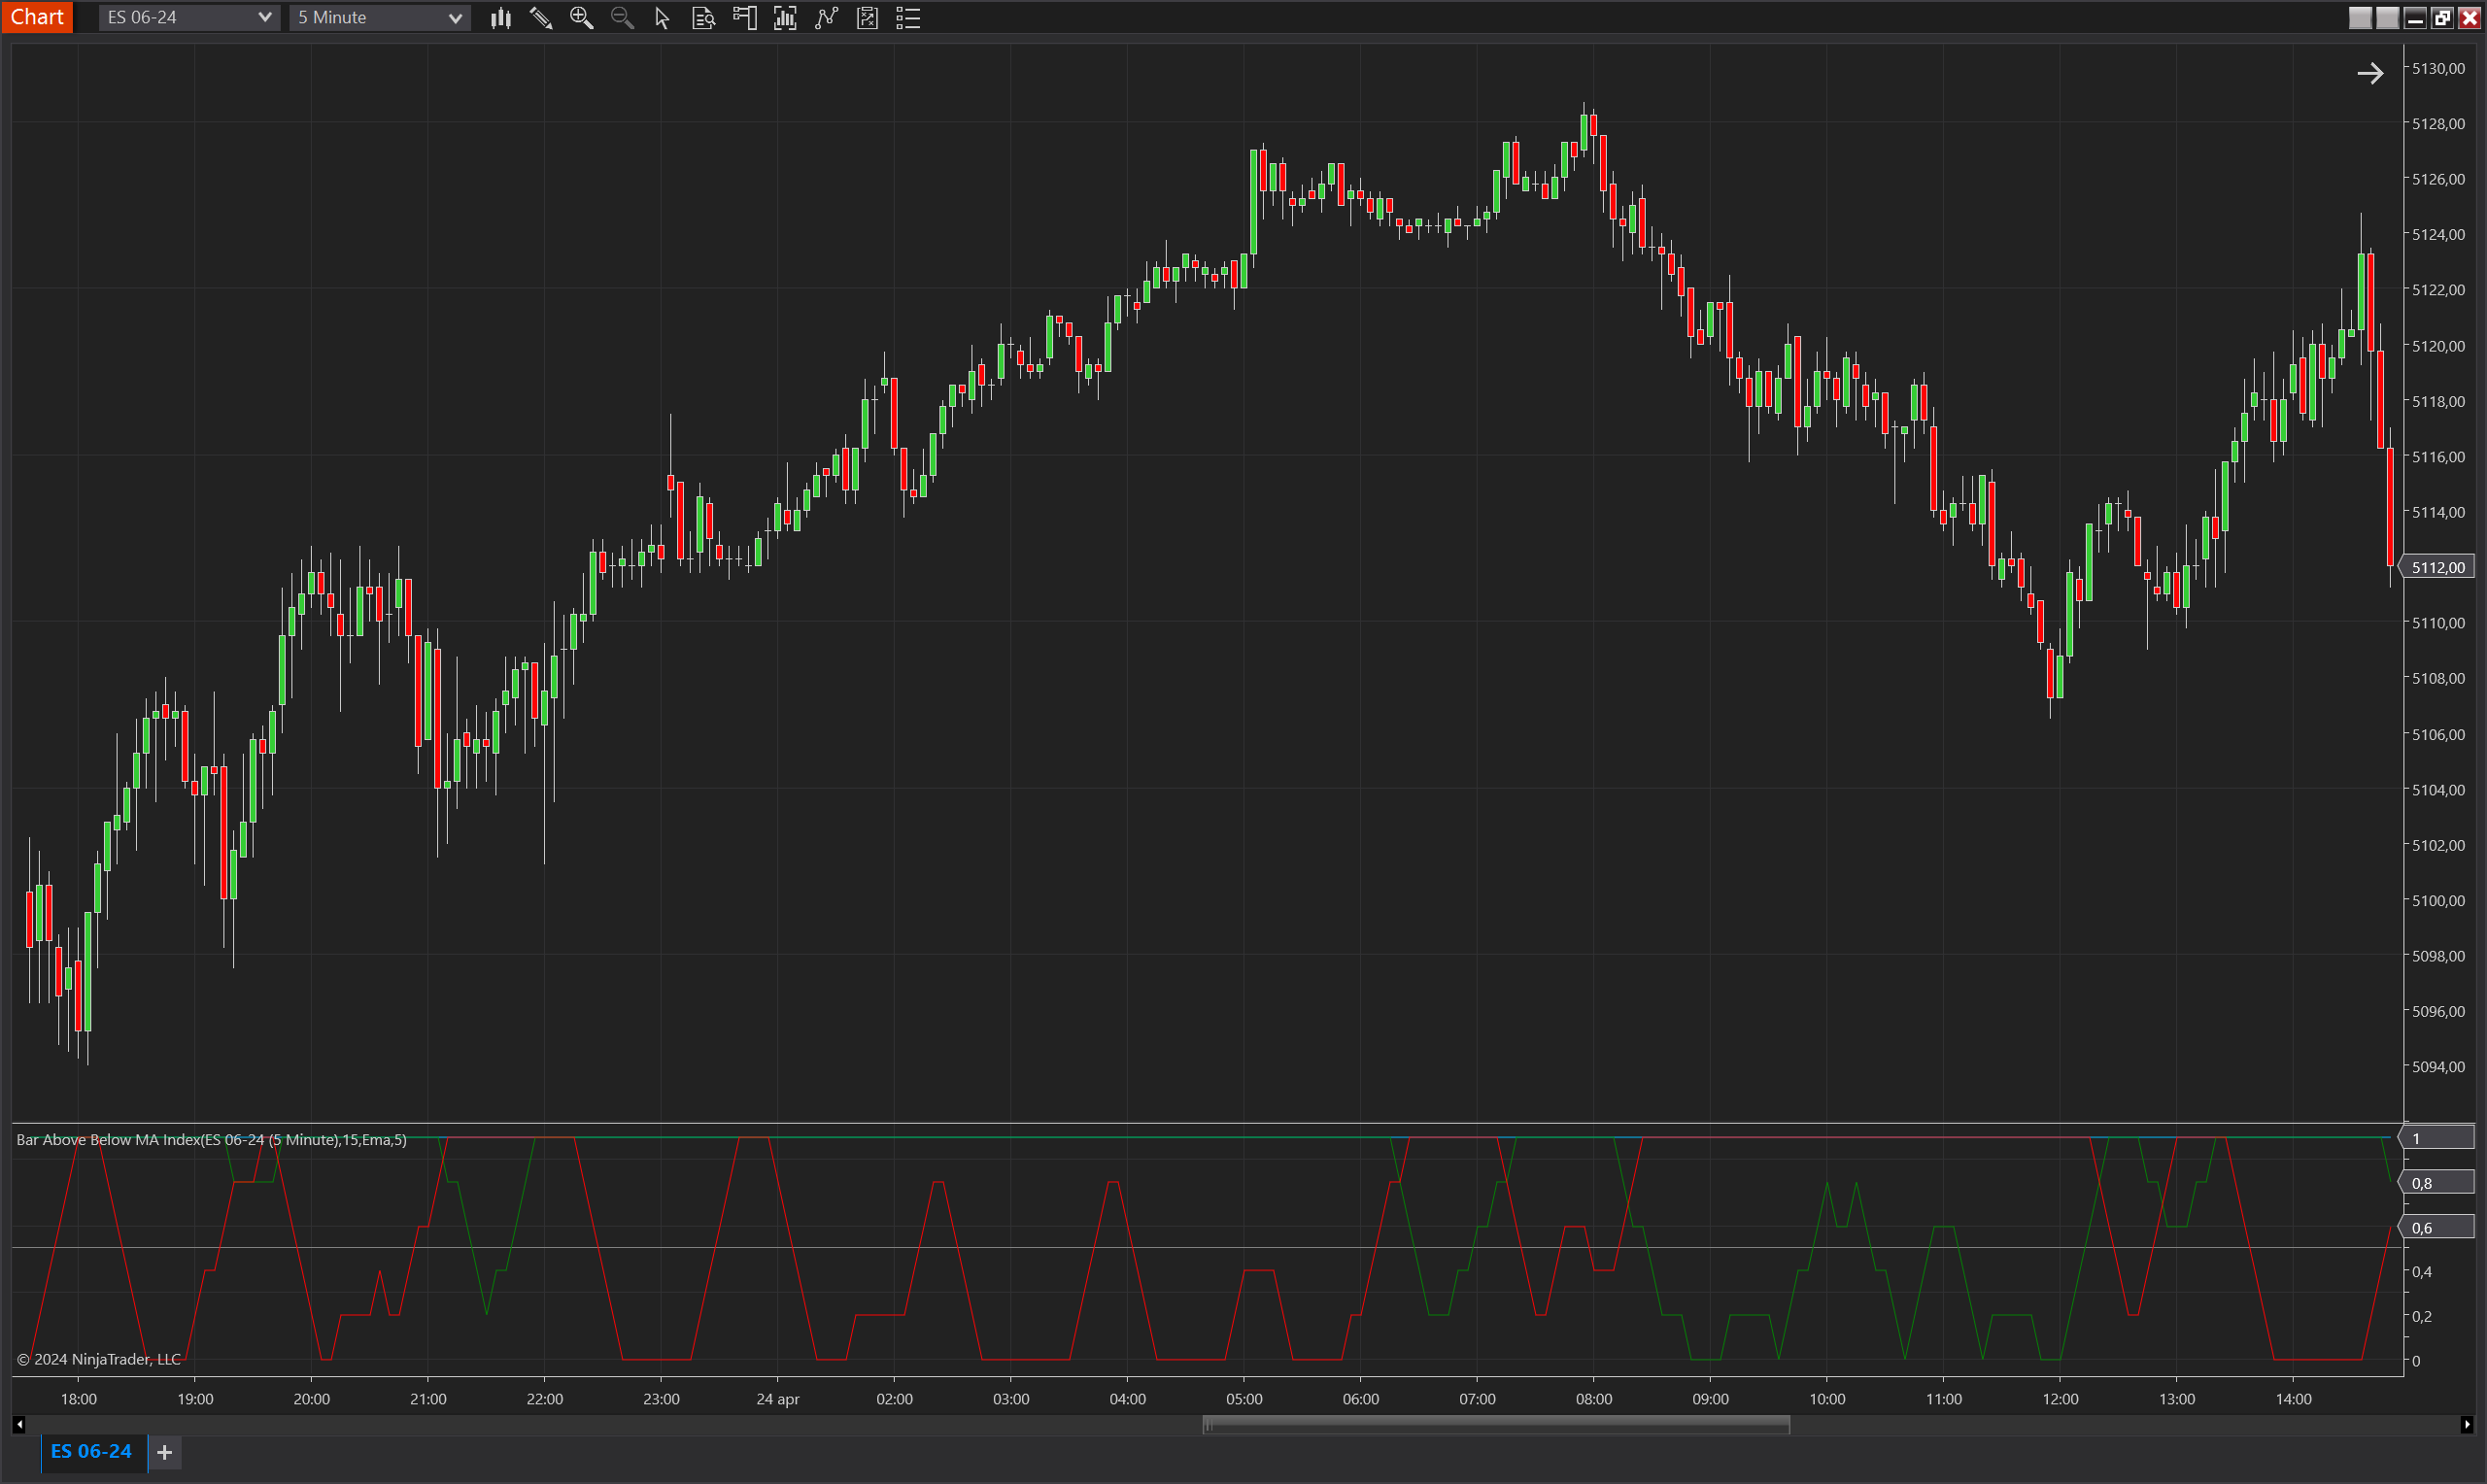
The Bar Above Below MA Index is an analytical tool designed for NinjaTrader 8 that provides insights into the interaction between price bars and a selected moving average. This indicator calculates an index based on whether each bar does not touch the moving average, effectively identifying periods where the price is either consistently above or below the moving average without intersecting it. It is particularly useful for detecting trends and potential reversal points by highlighting how often price bars remain detached from the moving average over a given period.
The index is divided into three components: total index, above MA index, and below MA index. Each component reflects the proportion of bars over a specified period that are either entirely above or below the moving average, providing a clear visualization of market sentiment and momentum relative to the average price.
Key Features
- Multiple Moving Average Support: Works with various types of moving averages, including Exponential Moving Average (EMA), Double Exponential Moving Average (DEMA), and Simple Moving Average (SMA), allowing users to tailor the indicator to their trading preferences.
- Segmented Index Calculation: Breaks down the index into three parts (total, above, below), offering detailed insights into the price dynamics relative to the moving average.
- Customizable Periods: Users can set the period for the index calculation and the moving average, enabling flexibility to match different trading styles and time frames.
- Visual Indicators: Provides plots in different colors (blue for total index, green for above MA index, red for below MA index) along with a threshold line, making it easy to interpret the data at a glance.
Tips for Implementation
- Trend Confirmation: Use the index to confirm ongoing trends. A high above MA index might indicate a strong uptrend, while a high below MA index could suggest a strong downtrend.
- Reversal Signals: Monitor the index for rapid changes or crossover points between the above and below MA indices as potential signals for trend reversals.
- Combination with Other Indicators: Pair this index with volume indicators or oscillators to confirm the strength of the detected trends or potential reversal points.
- Adjust Settings to Market Conditions: Modify the period settings for both the index and the moving average based on the asset's volatility and the dominant market conditions to optimize performance.
- Backtesting: Before applying the indicator in live trading, backtest it under various market scenarios and adjust the parameters to find the best setup for your trading strategy.
Parameters
Period
- Type: int
- Description: Specifies the number of bars over which the index is calculated. This period determines how the index averages the instances of bars not touching the moving average, offering insights into short-term or long-term trends based on the set value.
- Default Value: 5
- Valid Values: Any positive integer, allowing customization to suit different trading styles and time frames.
Moving Average Type
- Type: TdjMovingAverageProperties.MovingAverageType
- Description: Defines the type of moving average used in the calculation. Users can select from Exponential (EMA), Double Exponential (DEMA), or Simple Moving Average (SMA), providing flexibility to adapt the indicator to various analytical needs.
- Default Value: Ema (Exponential Moving Average)
- Options: Ema, Dema, Sma, allowing traders to choose the moving average that best fits their trading strategy.
MA Period
- Type: int
- Description: Determines the number of bars used to calculate the moving average. This setting affects how closely the moving average follows the price action, with shorter periods making it more responsive to recent price changes and longer periods providing a smoother average.
- Default Value: 15
- Valid Values: Any positive integer, which can be adjusted to reflect different market conditions and trading objectives.
Plots
Value
- Type: Plot
- Color: DeepSkyBlue
- Description: Represents the overall index value which indicates the proportion of bars that do not touch the moving average within the specified period. This plot provides a comprehensive view of how often price bars remain completely above or below the moving average, giving a general sense of market direction or neutrality.
ValueUp
- Type: Plot
- Color: Green
- Description: Shows the index value for bars that remain above the moving average. A higher value on this plot suggests a stronger uptrend or sustained bullish sentiment, as more bars are maintaining a position above the moving average without intersecting it.
ValueDown
- Type: Plot
- Color: Red
- Description: Displays the index value for bars that stay below the moving average. This plot is crucial for identifying downtrends or bearish periods, indicating that a significant number of bars are not touching the moving average from below.
Threshold
- Type: Line
- Color: Gray
- Description: A threshold line typically set at a critical value (like 0.5) to help identify when the index values are showing significant deviation from the norm. This line can aid in visualizing when the upward or downward bias becomes dominant or is weakening, providing a clear demarcation for easier decision-making.