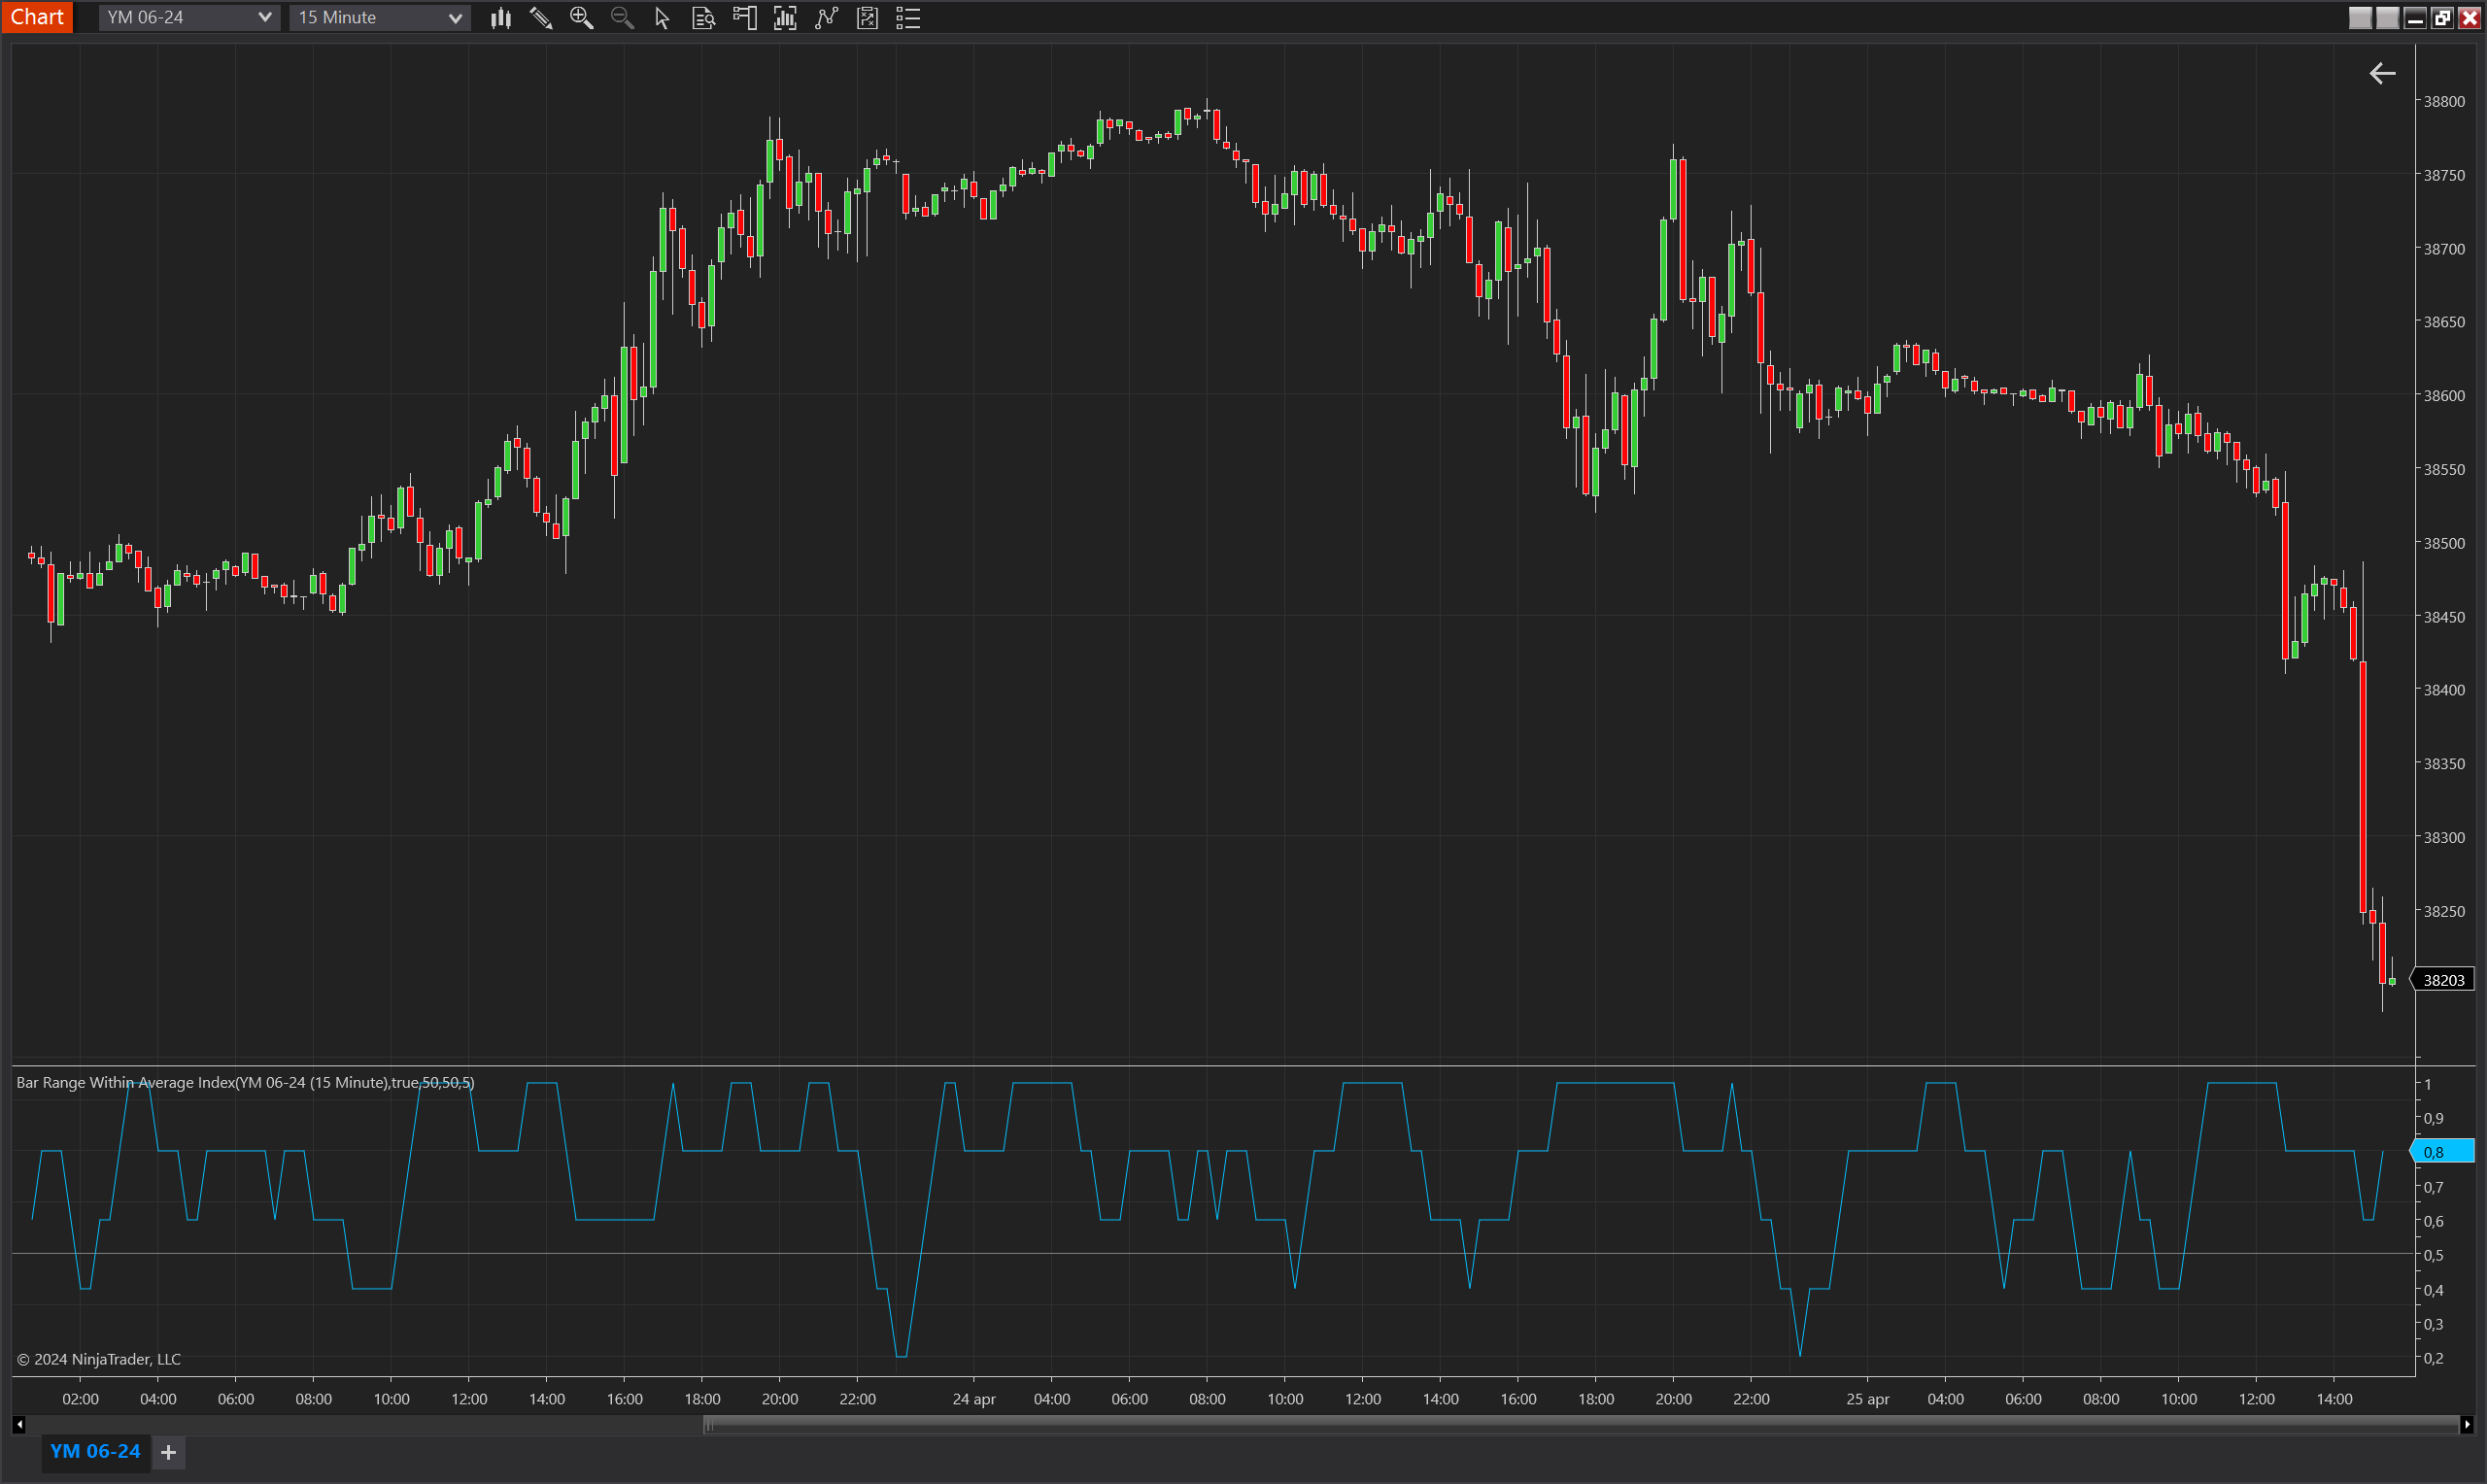
Bar Range Within Average Index
Description
The Bar Range Within Average Index is a dynamic indicator designed for the NinjaTrader 8 platform, aimed at analyzing market volatility and stability through the lens of bar range variability. This indicator assesses whether the full range (from high to low) of each bar fits within the average ranges of previous bars, calculated over a user-defined period. It helps traders identify periods when the market is behaving typically or exhibiting unusual activity by comparing the current bar's range to historical norms.
The indicator calculates an index based on the consistency of the bar range staying within set deviations from the average range. This measurement is especially useful for gauging market conditions, helping traders to decipher whether the market is settling into a trend or might be gearing up for a reversal or breakout.
Key Features
- Average Range Analysis: Computes the average bar range over a specified period and checks if current and past bar ranges fit within defined minimum and maximum deviations from this average.
- Customizable Deviation Percentages: Allows traders to set specific percentage thresholds for what constitutes a normal range deviation, providing flexibility to adapt the tool to various market conditions and trading strategies.
- Selective Comparison Option: Offers the ability to compare only the most recent bar against the average or include all bars within the set period in the comparison, enhancing the indicator's adaptability.
- Visualization: Includes a plot of the index values, helping traders visualize how often the current market activity aligns with historical patterns.
Tips for Implementation
- Market Volatility Insight: Utilize the indicator to understand market volatility. A higher index value could indicate stable market conditions, while lower values may signal increased volatility or the onset of a new trend.
- Combine with Other Indicators: Pair this indicator with momentum oscillators, volume indicators, or trend-following tools to confirm hypotheses about market conditions and to refine entry and exit points based on comprehensive analysis.
- Adjust Settings to Match Market Behavior: Modify the period and deviation percentages based on the asset's typical behavior and prevailing market conditions to maximize the utility and accuracy of the indicator.
- Backtesting for Calibration: Backtest the indicator using historical data to optimize the settings and validate its effectiveness across different market environments and time frames.
- Threshold Analysis: Employ the threshold line to quickly identify when index values cross significant levels, potentially indicating a change in market dynamics or confirming the strength of current trends.
Parameters
Period
- Type: int
- Description: Determines the number of bars used to calculate the average bar range. This period setting affects how the indicator computes the average, allowing traders to customize it based on their analytical needs and the typical market conditions they encounter.
- Default Value: 5
- Valid Values: Any positive integer, offering flexibility to suit different trading strategies and responsiveness preferences.
Min Bar Size Deviation Percent
- Type: int
- Description: Specifies the minimum percentage below the average bar range that a bar's range can deviate and still be considered within normal bounds. This setting helps define the lower threshold for typical market activity, enabling traders to identify unusually narrow bars.
- Default Value: 50
- Valid Values: Any non-negative integer, allowing for customization to different volatility levels and market behaviors.
Max Bar Size Deviation Percent
- Type: int
- Description: Defines the maximum percentage above the average bar range that a bar's range can deviate and still be considered within normal bounds. This parameter sets the upper threshold for what is considered typical market activity, helping traders spot unusually wide bars that might indicate increased volatility or potential market entries/exits.
- Default Value: 50
- Valid Values: Any non-negative integer, providing flexibility to accommodate various market conditions and trader preferences.
Compare Only New Bar
- Type: bool
- Description: When enabled, the indicator compares only the most recent bar's range to the average of the prior bars. If disabled, it compares all bars within the period to the average. This option adds versatility to how the indicator's readings can be interpreted and used in trading decisions.
- Default Value: false
- Options: true (Yes), false (No), enabling traders to tailor the indicator's focus according to their specific analysis needs or trading setups.
Plots
Value
- Type: Plot
- Color: DeepSkyBlue
- Description: Represents the index value calculated from the comparison of bar ranges to the average range. The plot shows the proportion of bars within the specified period that meet the deviation criteria, providing a visual measure of how often bars stay within typical size ranges relative to the average.
Threshold
- Type: Line
- Color: Gray
- Description: A threshold line typically set at a critical value (such as 0.5) to help traders quickly identify when the index value signifies that a significant number of bars are deviating from the average. This line can be used to discern levels of market stability or alert traders to increased volatility or potential price breakouts.