New Donchian High Index
Description
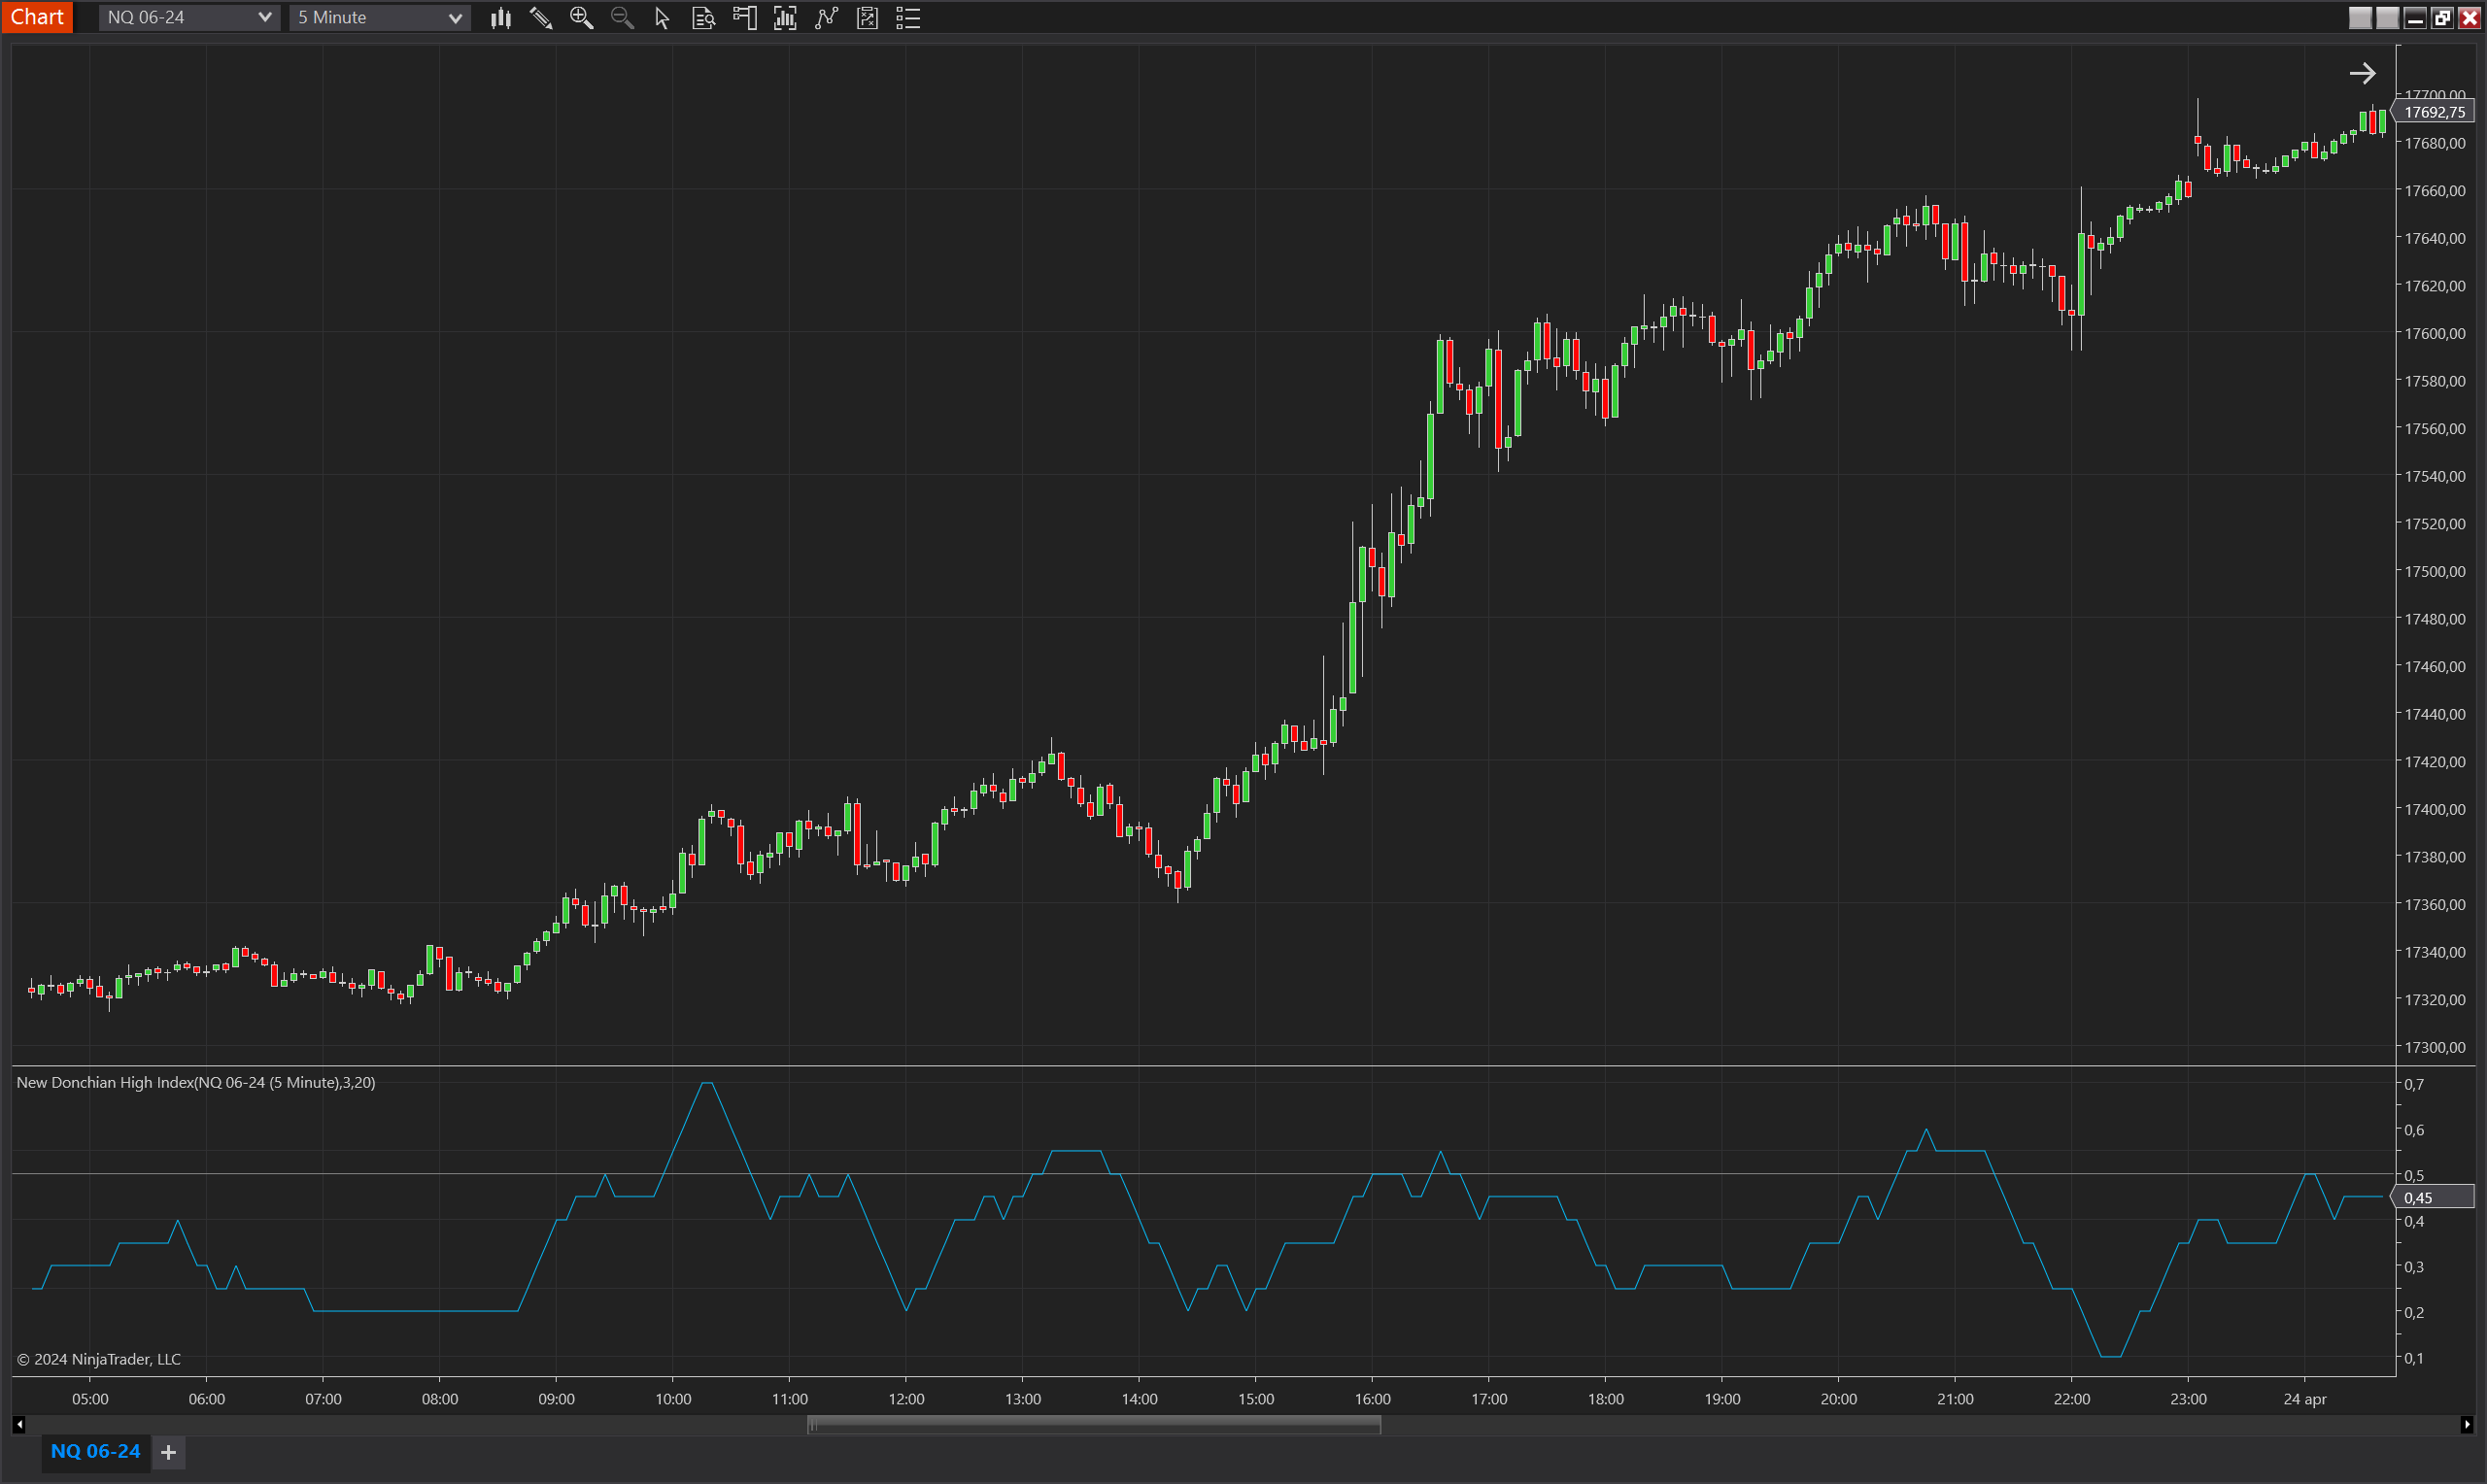
The New Donchian High Index is a powerful indicator for NinjaTrader 8 that tracks the frequency of new highs being made in the Donchian Channel over a specified period. This index is particularly useful for identifying breakout trends and momentum in the market, as it provides insights into how often the upper band of the Donchian Channel is reaching new peaks, suggesting strong bullish momentum or potential breakouts.
Key Features
- Donchian Channel Highs: Monitors the upper band of the Donchian Channel to detect when it hits new highs, indicating upward market movement and potential entry points for breakout strategies.
- Index Calculation: Calculates an index based on the proportion of periods during which a new high is recorded in the upper band relative to the total number of periods analyzed.
- Customizable Periods: Allows traders to set both the look-back period for the index calculation and the period over which the Donchian Channel is calculated. This customization helps traders tailor the indicator to fit different trading styles and time frames.
- Visual Tools: Includes a plot of the index values and a threshold line to help traders visually assess the frequency of new highs and gauge the strength of the market's upward momentum.
Tips for Implementation
- Breakout Strategy Enhancement: Use the New Donchian High Index to complement breakout trading strategies. An increasing index value can confirm the strength of a breakout, providing a reliable signal to enter long positions.
- Combine with Volume Analysis: Pair this index with volume indicators to confirm breakout signals. Increasing volume accompanying new highs in the Donchian Channel can validate the strength of the breakout.
- Threshold Adjustments: Set the threshold line at strategic levels to identify significant changes in the index's value. Crossing these levels can signal an increase in market volatility and momentum, prompting timely trading decisions.
- Period Optimization: Adjust the DC Period and the index's period settings based on the asset's volatility and trading frequency. Shorter periods may be suitable for fast-moving markets, while longer periods can provide more stability in slower markets.
- Backtesting: Validate the indicator's effectiveness by backtesting it under various market conditions. This practice helps refine the indicator settings and improve its predictive accuracy in real trading scenarios.
The New Donchian High Index is an essential tool for traders focusing on trend following and breakout strategies, providing critical information on market trends and helping to optimize entry and exit points based on robust technical analysis.
Parameters
Period
- Type: int
- Description: Specifies the number of bars over which the index is calculated. This setting affects how the indicator aggregates the instances where new highs are recorded in the Donchian Channel, providing insights into the consistency and frequency of such events.
- Default Value: 5
- Valid Values: Any positive integer, enabling traders to adjust the sensitivity and responsiveness of the indicator to match their specific trading strategy and market conditions.
DC Period
- Type: int
- Description: Determines the length of the Donchian Channel used to identify new highs. This parameter sets how many bars back the channel considers to establish its upper and lower bounds, impacting the detection of breakout points.
- Default Value: 3
- Valid Values: Any positive integer, offering flexibility for traders to tailor the channel according to different asset behaviors and volatility levels.
Plots
Value
- Type: Plot
- Color: DeepSkyBlue
- Description: Represents the index value that quantifies the proportion of periods the Donchian Channel's upper band has made new highs relative to the total periods considered. This plot helps visualize the trend's strength and the frequency of new highs, providing a clear graphical representation of upward market momentum.
Threshold
- Type: Line
- Color: Gray
- Description: A threshold line, typically set at a value like 0.5, that helps identify significant changes in the frequency of new highs. Crossing this line can indicate increased momentum and potential market breakouts, serving as a visual aid for making informed trading decisions.