VWAP (Volume-Weighted Average Price)
Description
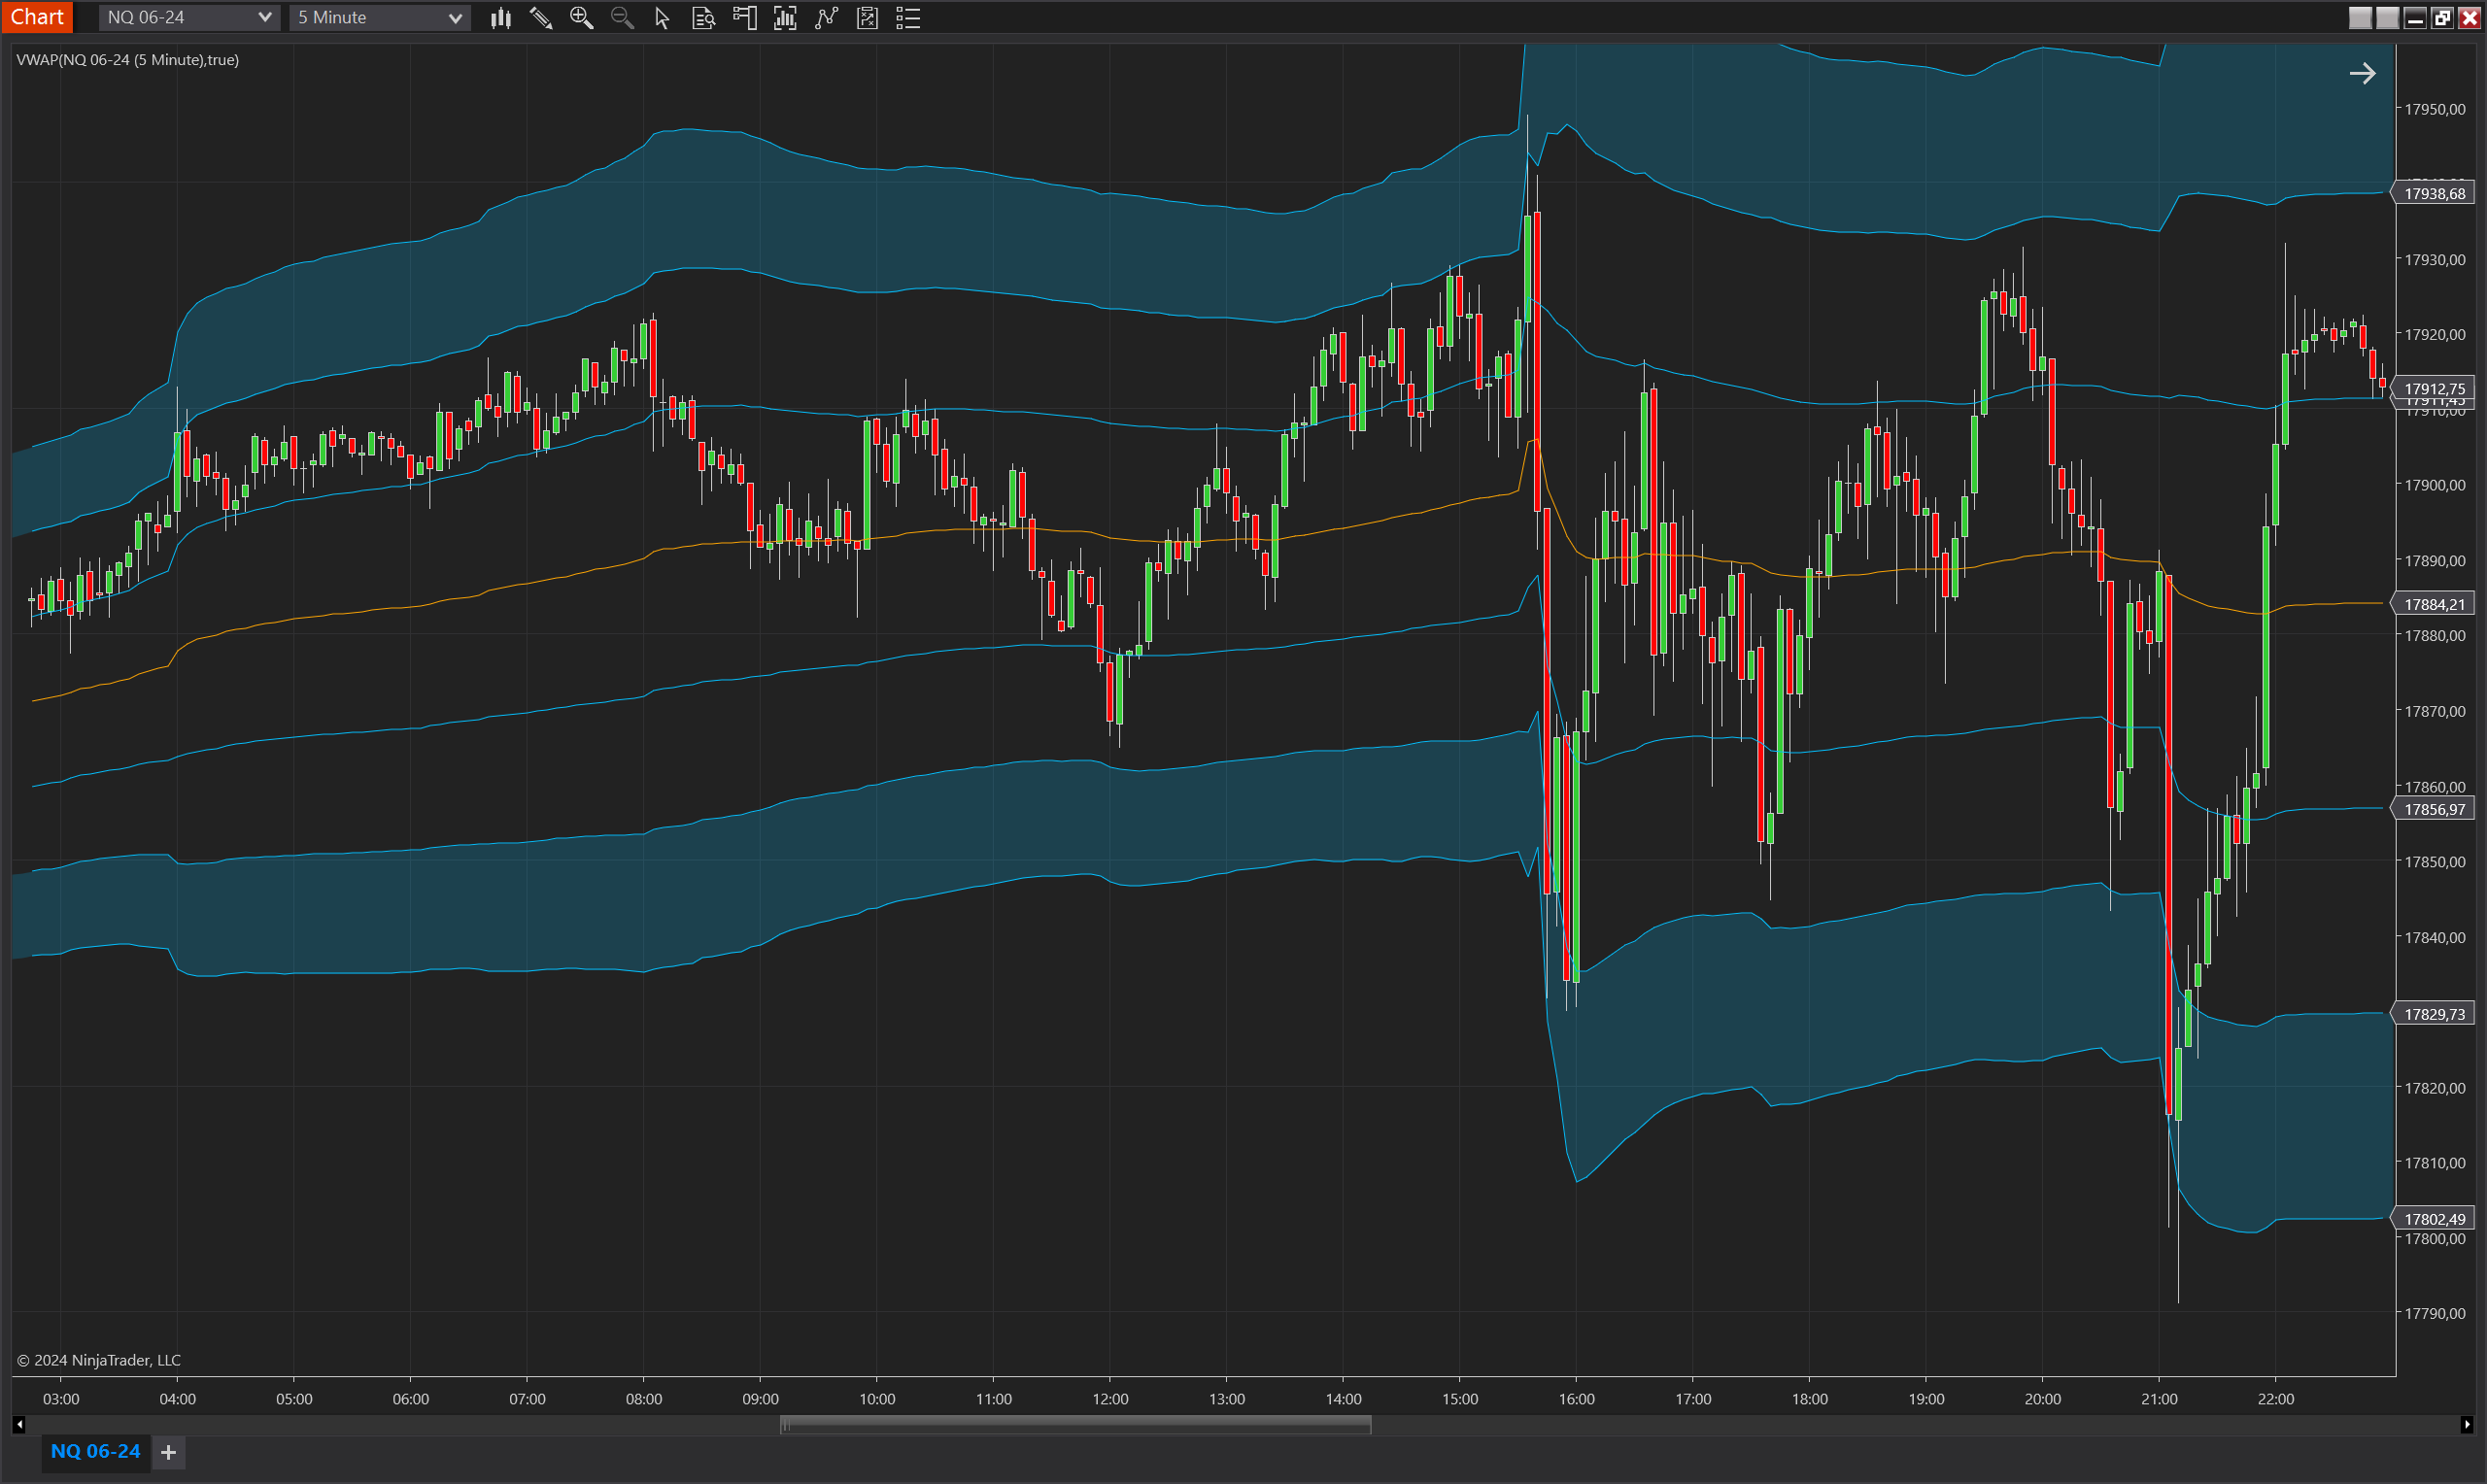
The VWAP indicator calculates the volume-weighted average price of an asset, providing traders with a benchmark price anchored to the session start. This indicator aggregates the cumulative volume and typical volume of each bar to compute the VWAP value, which serves as a dynamic support/resistance line in trading strategies. Additionally, the VWAP indicator incorporates standard deviation bands around its central line, offering insights into price volatility and potential breakout levels.
Key Features:
- VWAP Calculation: The indicator aggregates cumulative volume and typical volume to compute the VWAP value. This value acts as a dynamic support/resistance level, aiding in trend-following or counter-trend strategies.
- Standard Deviation Bands: The indicator calculates three sets of upper and lower bands, representing 1, 2, and 3 standard deviations from the VWAP. These bands provide additional context for price volatility and can signal potential breakouts or mean reversion opportunities.
- Customizable Shading: The area between the second and third standard deviation bands can be shaded with a specified color and opacity, offering visual clarity to traders.
- Session Anchoring: The VWAP calculation resets at the start of each session, anchoring the indicator to session boundaries and making it especially useful for intraday trading strategies.
- Visual Representation: The indicator includes visual plots for VWAP and standard deviation bands, enhancing interpretability. Traders can use these plots to gauge potential support and resistance levels or identify trending behavior.
Tips for Implementation:
- Strategic Confirmation: Combine VWAP and its standard deviation bands with key support and resistance levels for added confirmation before entering or exiting trades.
- Volatility Assessment: Use the standard deviation bands to assess market volatility, ensuring alignment with suitable market environments for specific strategies.
- Parameter Customization: Adjust shading options to balance visual clarity and customization, making the indicator more effective for different trading scenarios.
- Complementary Indicators: Pair VWAP with indicators such as Bollinger Bands or RSI to corroborate its signals and enhance decision-making.
- Backtesting Necessity: Backtest the VWAP indicator across various market conditions to refine its parameters and confirm its efficacy within your trading system.
Parameters
ShowStdDiv:
- Type: bool
- Description: Enables or disables the display of standard deviation bands around the VWAP line.
- Default Value: True
StdDevShadingEnabled:
- Type: bool
- Description: Enables or disables shading between the second and third standard deviations.
- Default Value: True
ShadingColor:
- Type: Brush
- Description: Allows users to select the color of the shaded region between the second and third standard deviations.
ShadingOpacity:
- Type: int
- Description: Allows users to adjust the opacity of the shaded region, providing fine-tuned visual customization.
- Default Value: 20
- Valid Values: 0 to 100
Plots
VWAP:
- Type: Plot
- Style: Line
- Color: Orange
- Description: Represents the volume-weighted average price of the asset, serving as a dynamic support or resistance level for trading strategies.
StdDev1Upper & StdDev1Lower:
- Type: Plot
- Style: Line
- Color: DeepSkyBlue
- Description: Indicate the first standard deviation bands from the VWAP line, providing context for price volatility and serving as potential breakout or reversal markers.
StdDev2Upper & StdDev2Lower:
- Type: Plot
- Style: Line
- Color: DeepSkyBlue
- Description: Represent the second standard deviation bands from the VWAP, giving additional context for volatility and potential trading signals.
StdDev3Upper & StdDev3Lower:
- Type: Plot
- Style: Line
- Color: DeepSkyBlue
- Description: Denote the third standard deviation bands from the VWAP, offering a broader view of potential price movements and volatility.