Bars Range HL
Description
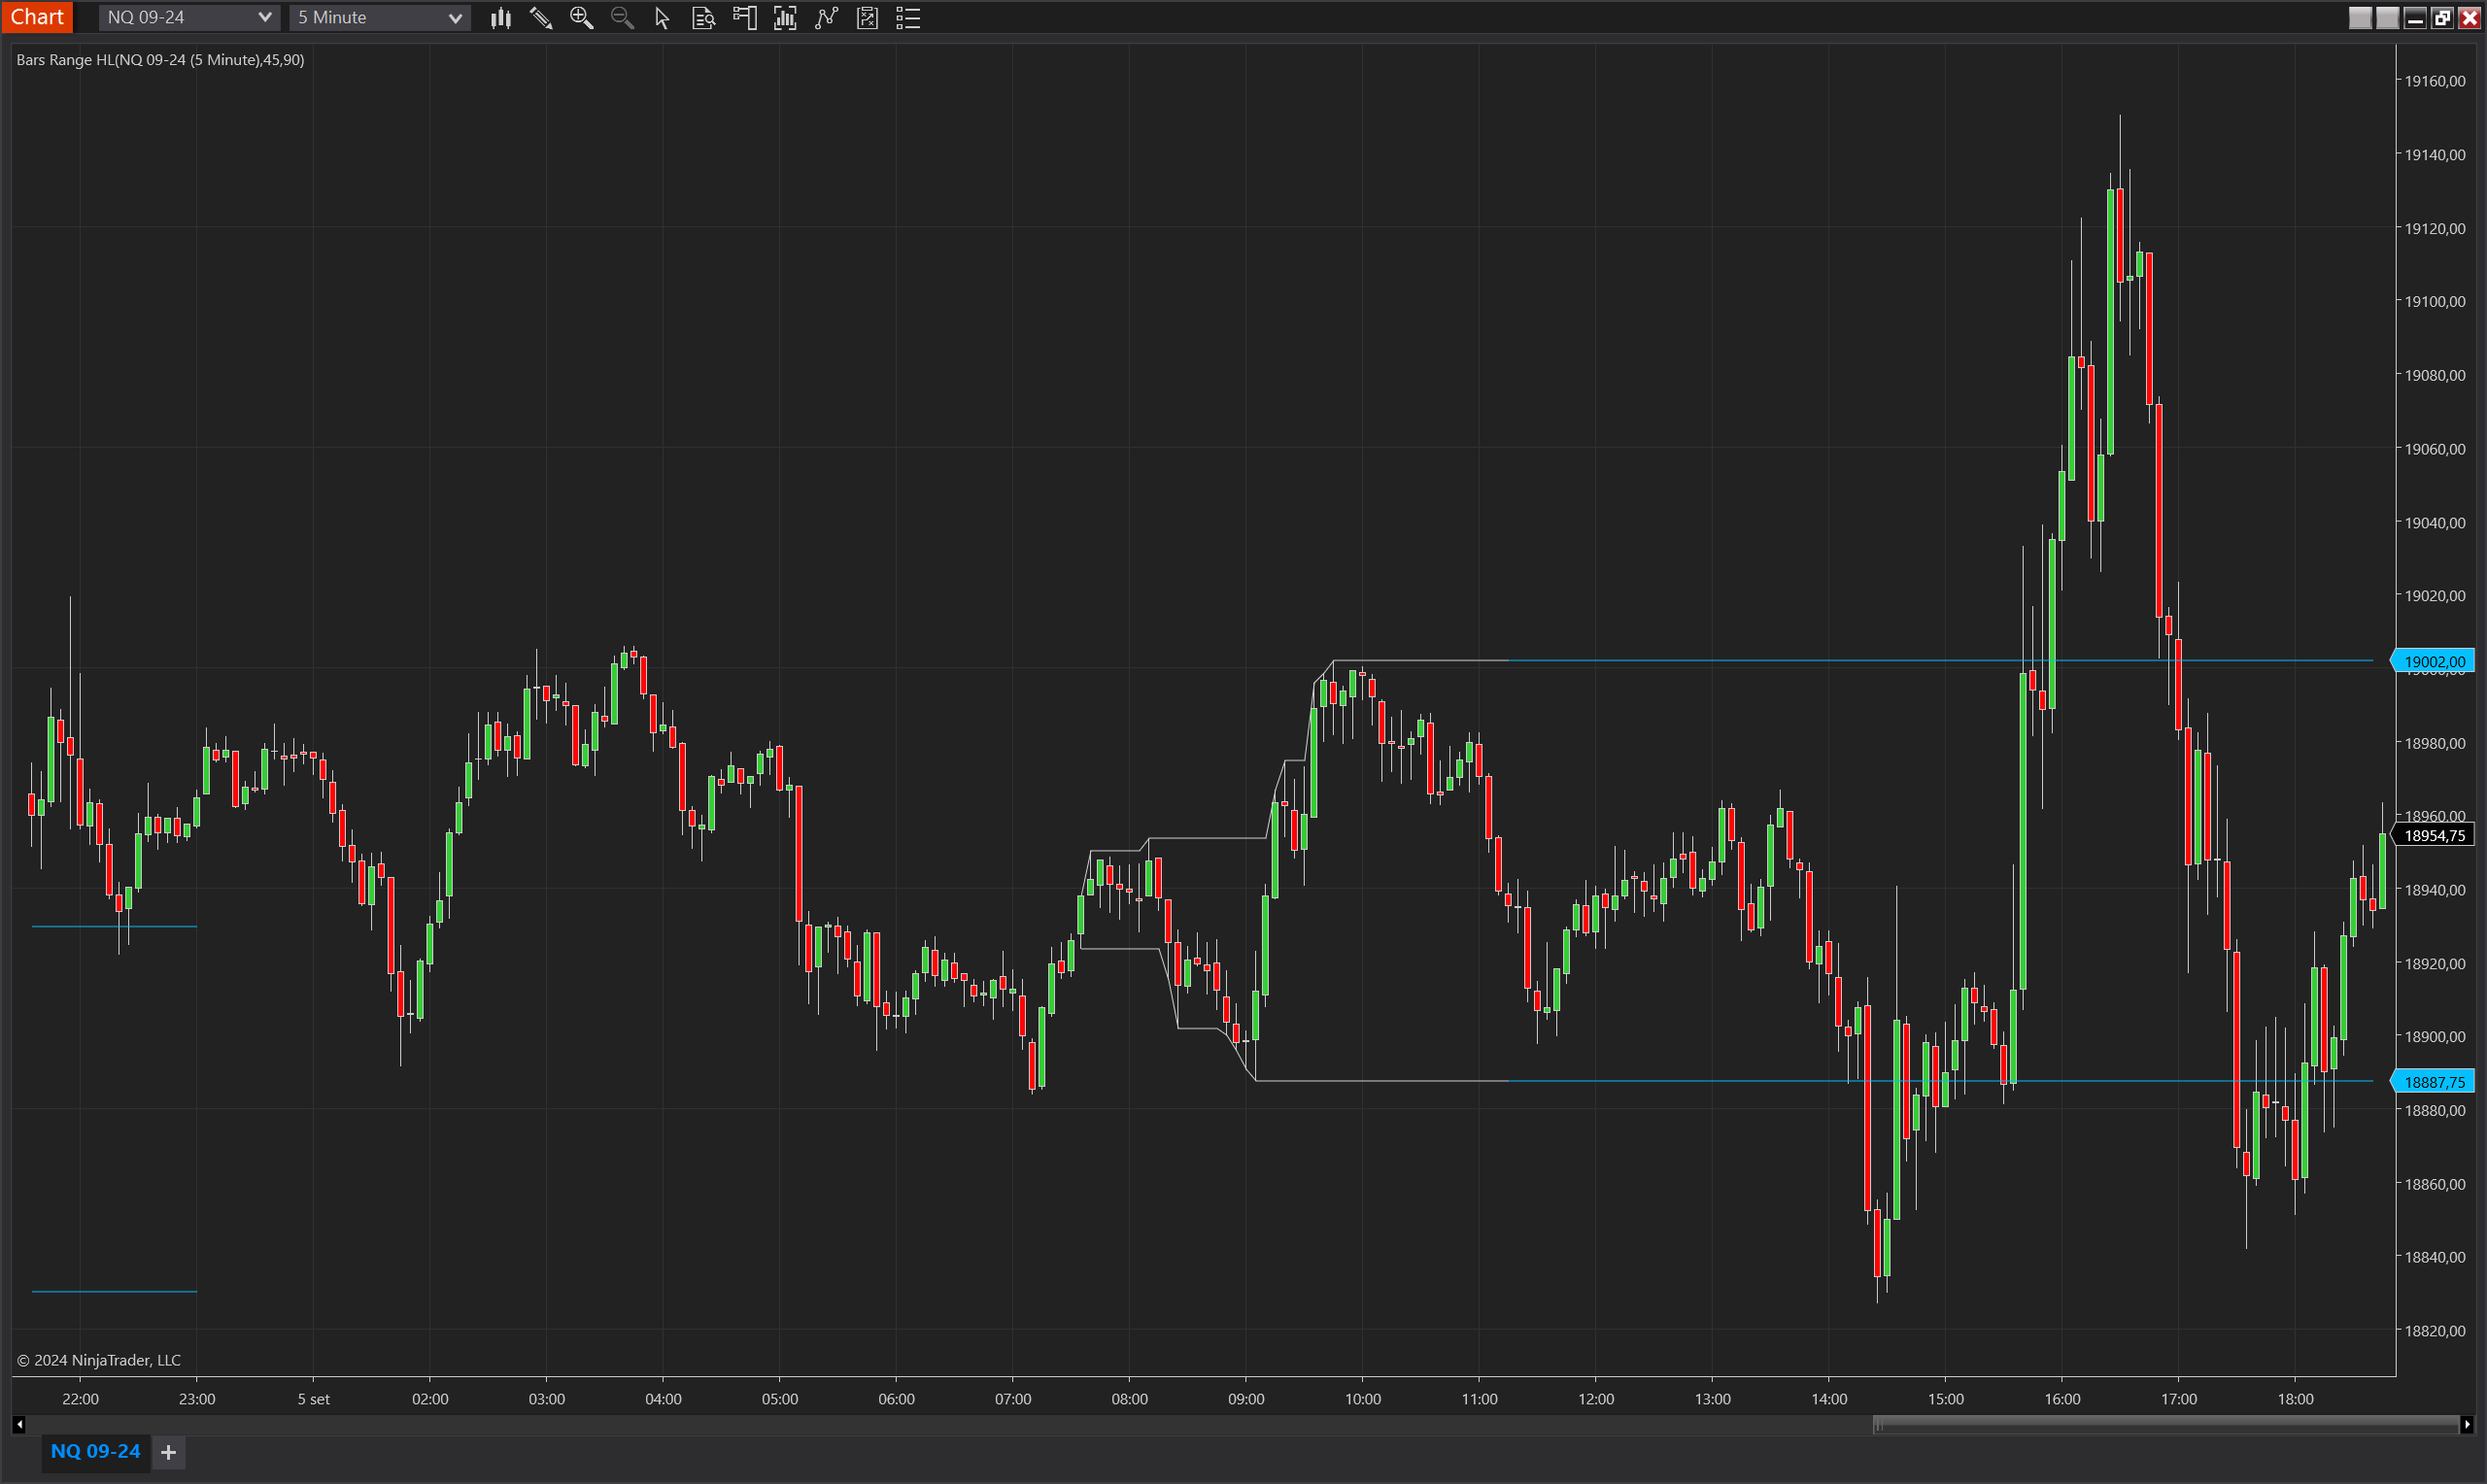
The Bars Range HL indicator dynamically calculates the high and low price range over a specified number of bars using an index-based approach rather than time. This provides traders greater control and flexibility for tracking price movements during a session. By specifying a starting point using a bar index, this indicator allows users to monitor price ranges for more efficient session analysis, useful in both trending and ranging markets. It's an overlay indicator that visually plots the high and low levels on the price chart, making it easy to identify potential support and resistance levels.
Key Features:
- Customizable Bar Range: Adjust the number of bars to calculate the price range, offering traders flexibility in determining optimal range periods.
- Index-Based Calculation: Tracks ranges based on bar count instead of time, allowing precise range monitoring from specific session points.
- Visual Confirmation: Displays upper and lower range boundaries directly on the chart, with customizable colors for real-time feedback on forming ranges.
- Session Reset: Automatically resets the range calculation at the start of each new session, providing clear tracking for intraday trading.
- Customizable Starting Bar: Traders can choose the starting point of the range calculation to align with specific strategies.
Tips for Implementation:
- Strategic Confirmation: Use the upper and lower bounds as dynamic support and resistance levels, confirming potential trade entries when these levels align with other indicators (e.g., RSI, Moving Averages).
- Volatility Assessment: Combine this indicator with volatility measures (e.g., Bollinger Bands) to confirm suitable market environments for range trading.
- Parameter Customization: Adjust the RangeSize and StartBarIndex to match the timeframes and strategies you are trading.
- Backtesting Necessity: Backtest across multiple market conditions to ensure the settings align with your strategy's performance over time.
Parameters
RangeSize
- Type: int
- Description: The number of bars to calculate the high-low range.
- Default Value: 45
- Valid Values: Any integer greater than or equal to 0
StartBarIndex
- Type: int
- Description: Defines the bar index to begin the range calculation (0 for starting from the session open).
- Default Value: 90
- Valid Values: Any integer greater than or equal to 0
FormingRangeColor
- Type: Brush
- Description: Color used to display the forming range when the range is not yet complete.
- Default Value: LightGray
- Valid Values: Any valid color brush
Plots
Upper
- Type: Plot
- Style: Solid Line
- Color: DeepSkyBlue
- Description: Represents the upper boundary of the calculated price range. Traders can use this plot to identify potential resistance levels within the range period.
Lower
- Type: Plot
- Style: Solid Line
- Color: DeepSkyBlue
- Description: Represents the lower boundary of the calculated price range. Traders can use this plot to identify potential support levels during the session.