Light Volume Profile By Period
Description
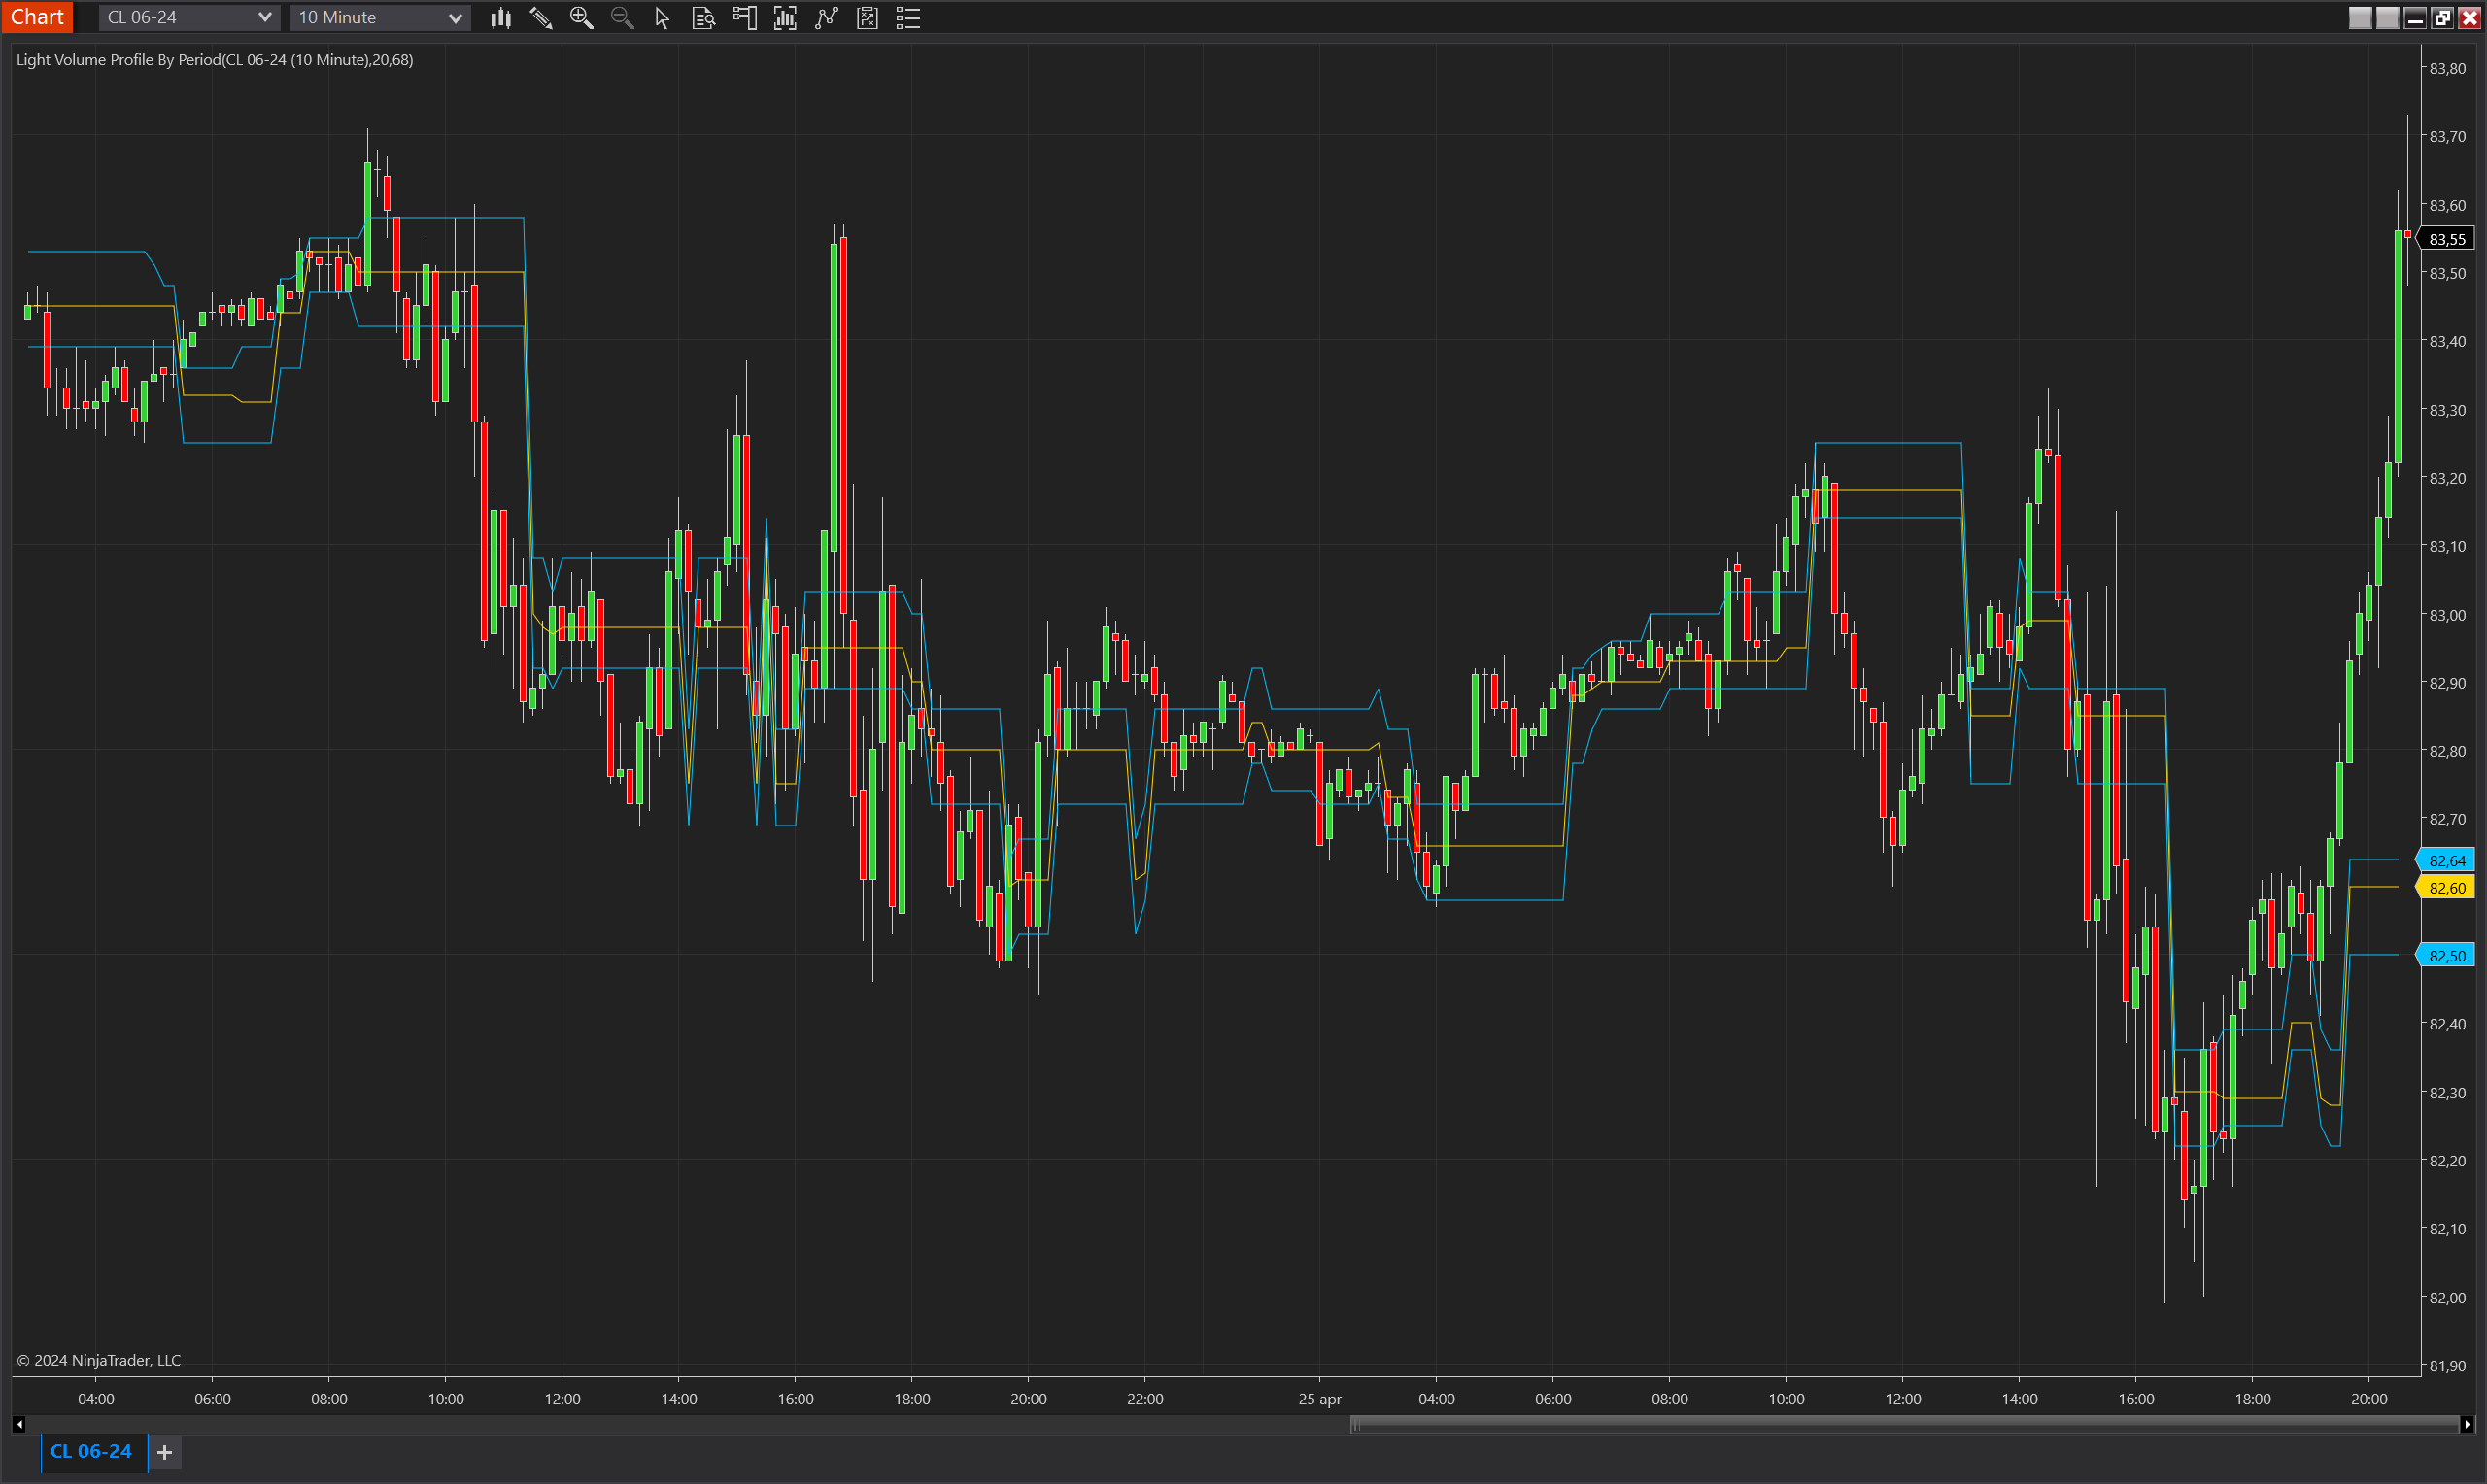
The Light Volume Profile By Period indicator is designed to track and visualize the most actively traded price levels dynamically (Point of Control, POC) and the value area within a defined number of bars. This indicator is particularly useful for identifying areas where significant trading activity has occurred, suggesting key levels of support and resistance that are recognized by market participants.
Key Features
- Dynamic POC: Calculates the price level with the highest trading volume within the selected period, indicating the market's consensus value area.
- Value Area: Defines the price range where a specified percentage of the trading volume has occurred, highlighting potential support and resistance areas.
- Configurable Period and Value Area Percentage: Allows customization of the look-back period and the percentage of total volume that defines the value area, tailoring the indicator to different trading styles and market conditions.
Tips for Implementation
- Support and Resistance Levels: Use the POC and value area boundaries to identify potential support and resistance levels. Prices may bounce off or break through these levels, signalling entry or exit points.
- Trade Confirmation: Confirm trading signals with the POC and value area. A trade entry near the lower boundary of the value area can be confirmed if the price moves towards the POC, suggesting a return to a high-volume price.
- Adjust Settings: Experiment with different period settings and value area percentages to match the volatility and volume patterns of the asset being traded. Higher volume percentages and shorter periods can be used in fast-moving markets.
Important: Tick Replay must be enabled for the "Light Volume Profile By Period" indicator to function correctly. Tick Replay is essential as it allows the indicator to access historical tick data required for accurate volume profile calculations. Without enabling Tick Replay, the indicator will not display historical values or operate as intended. Ensure that this feature is active in your trading platform settings when using this indicator to guarantee accurate data representation and analysis.
Parameters
Period
- Type: Integer
- Description: Determines the number of bars over which the volume profile is calculated. A larger period provides a broader view of market activity but may incorporate outdated information as market conditions change.
- Range: 1 to an upper limit set by the user or system constraints.
Value Area Percentage
- Type: Integer
- Description: Specifies the percentage of the total traded volume that defines the value area. This parameter helps identify the price range within which a substantial portion of trading has occurred, suggesting key levels of interest to traders.
- Range: 1% to 100%, with common settings around 70% to represent significant volume concentrations.
Plots
POC (Point of Control)
- Type: Plot
- Style: Line
- Color: Gold
- Description: Marks the price level with the highest trading volume within the selected period. This line serves as a strong indicator of the price most accepted by traders during the observed period, often acting as a pivotal point or level of significant market interest.
Value Area High
- Type: Plot
- Style: Line
- Color: DeepSkyBlue
- Description: Represents the upper boundary of the value area, above which a specified percentage (set by the Value Area Percentage parameter) of the total trading volume occurs. This line can act as a resistance level in technical analysis, indicating where significant trading activity has concentrated and tapering off.
Value Area Low
- Type: Plot
- Style: Line
- Color: DeepSkyBlue
- Description: Indicates the lower boundary of the value area, below which a specified percentage (set by the Value Area Percentage parameter) of the total trading volume occurs. Similar to the Value Area High, this line can serve as a support level, showing where significant trading activity has concentrated and tapering off.