Momentum Structure HL
Description
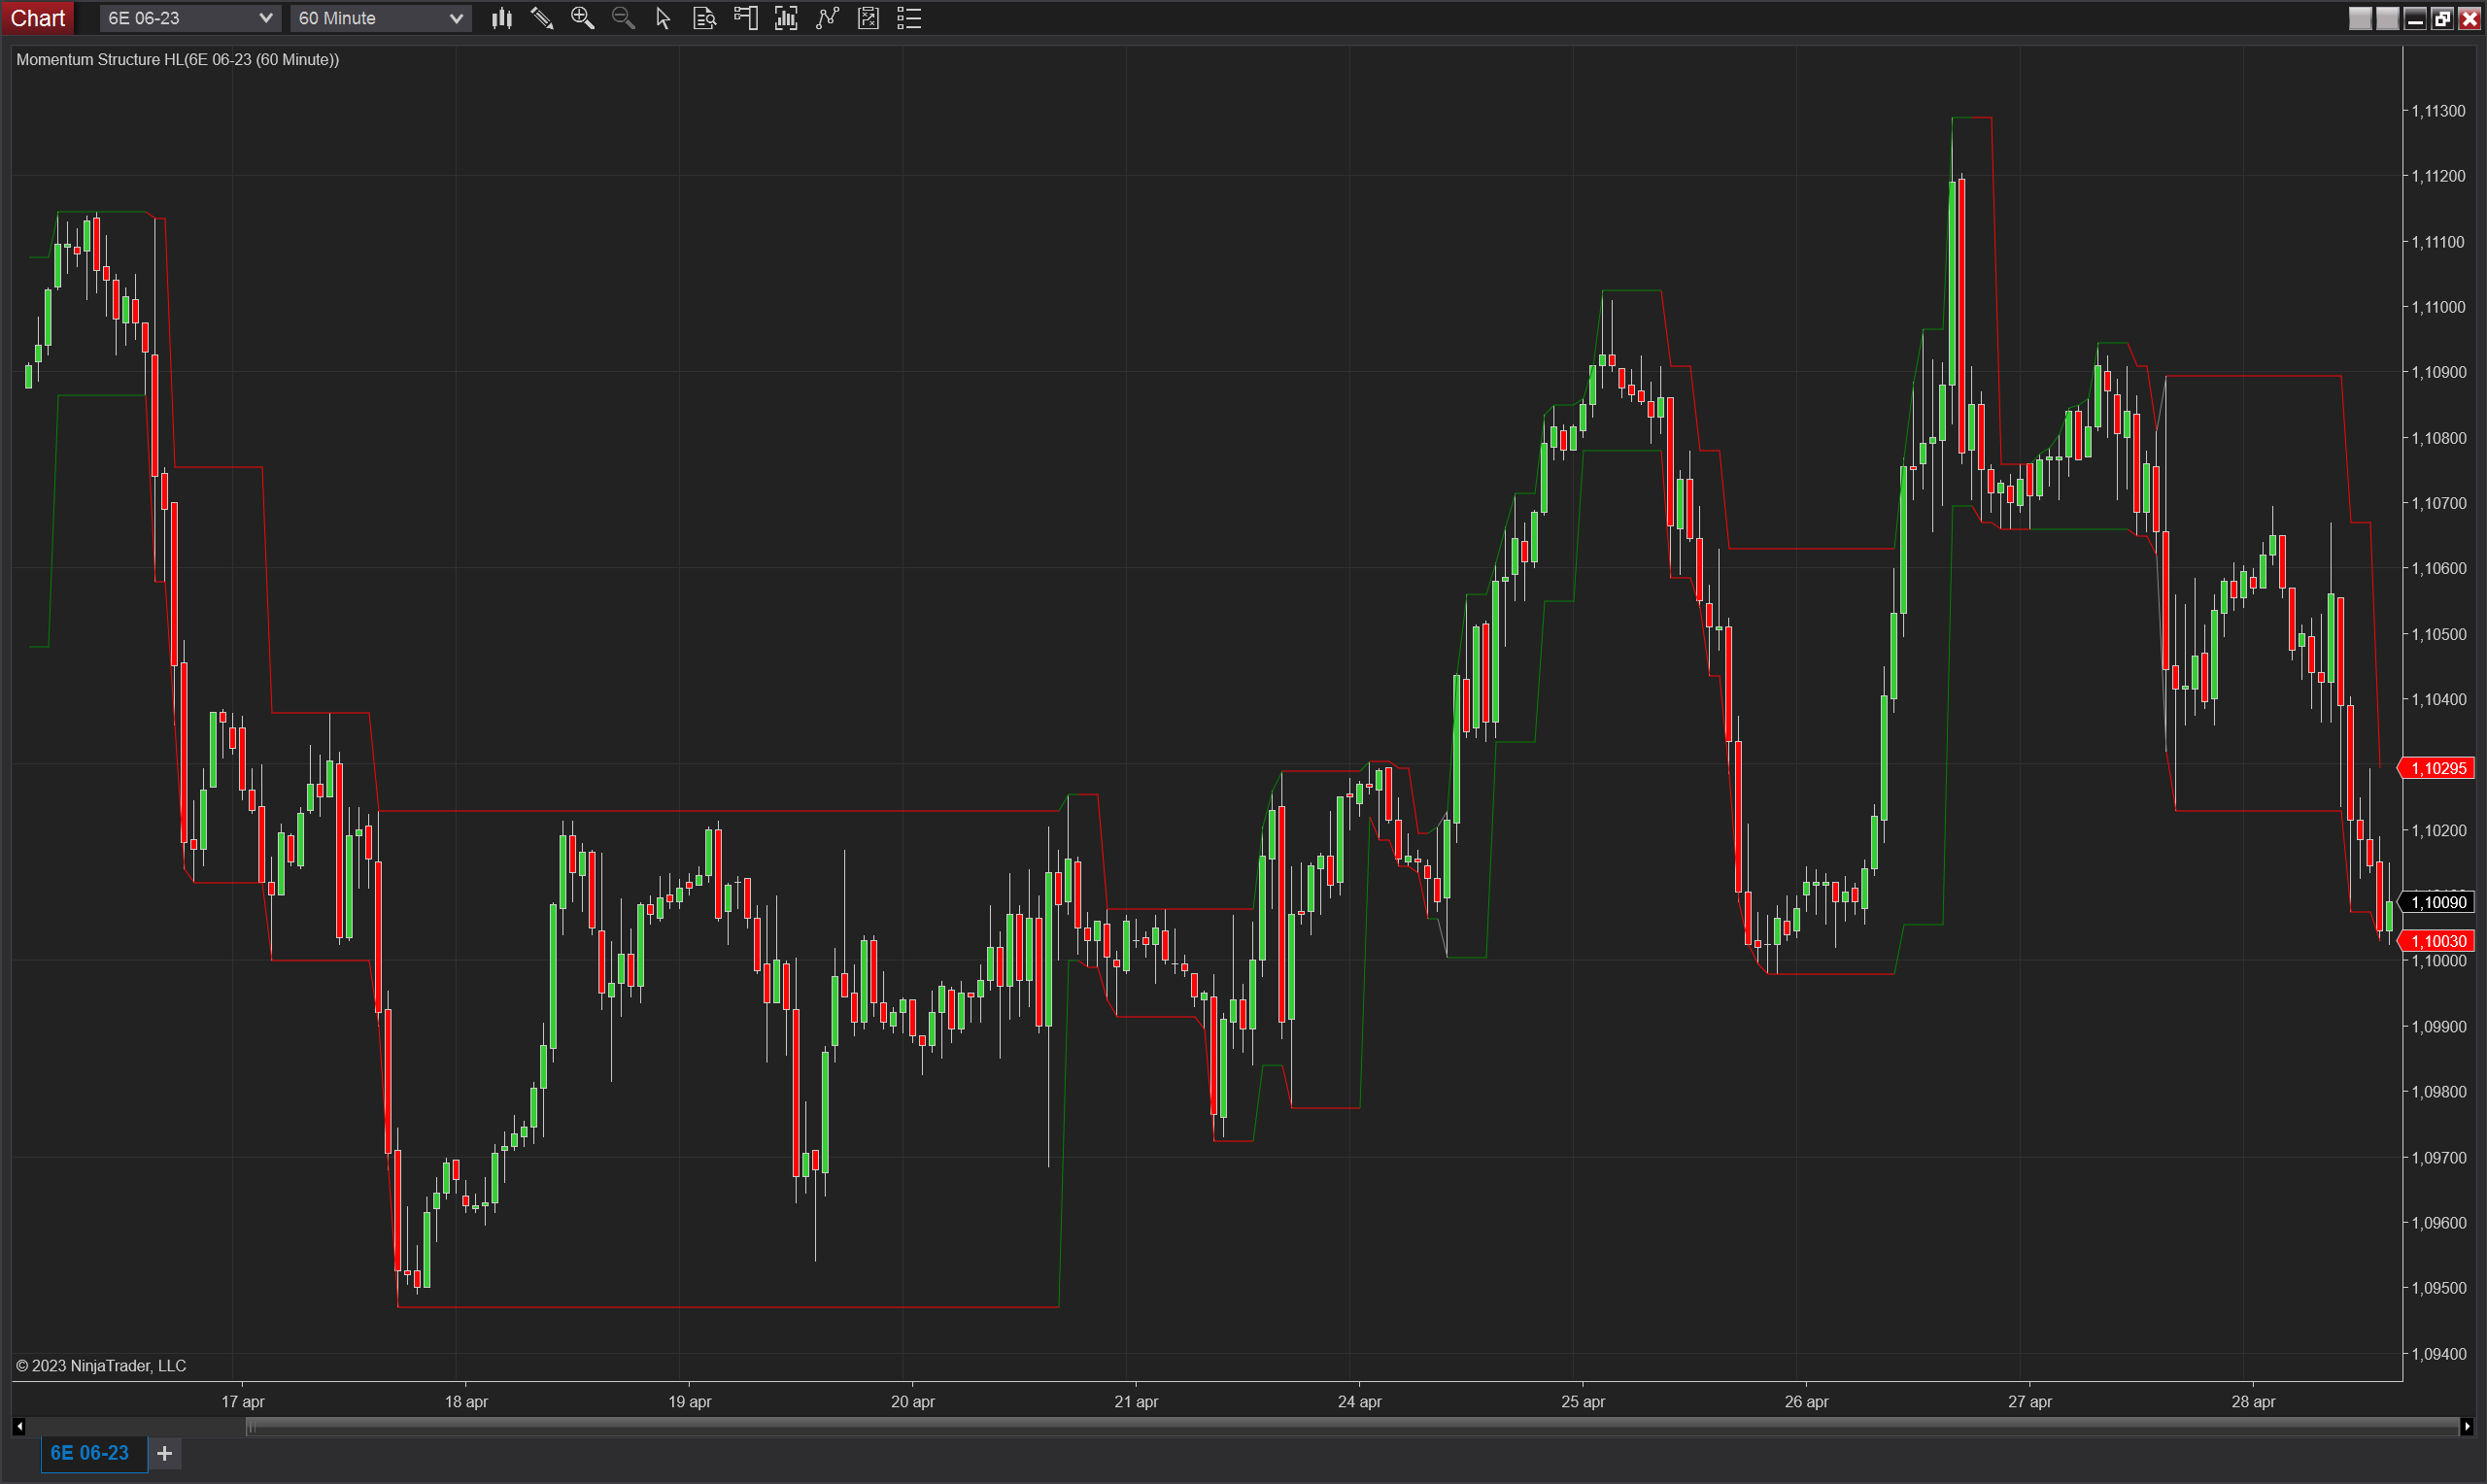
The Momentum Structure HL indicator is a technical analysis tool for NinjaTrader 8 that helps traders identify potential support and resistance levels in the market.
The indicator works by analyzing the recent price action and trend to calculate two levels: the Upper level and the Lower level. The Upper level represents a potential resistance level, while the Lower level represents a potential support level.
When a new bar appears, the indicator looks at the high and low prices of the bar and compares them to the Upper and Lower levels of the previous bar. If the current high price is higher than the previous Upper level and the current low price is lower than the previous Lower level, there is no clear trend, and the Upper and Lower levels are updated to the current high and low prices, respectively.
If the current high price is higher than the previous Upper level but the current low price is not lower than the previous Lower level, the indicator determines that the trend is up. The Upper level is updated to the current high price, and the Lower level is set to the minimum of the current low price and the last potential Lower level is calculated in the previous bar.
If the current low price is lower than the previous Lower level but the current high price is not higher than the previous Upper level, the indicator determines that the trend is down. The Lower level is updated to the current low price, and the Upper level is set to the maximum of the current high price and the last potential Upper level is calculated in the previous bar.
The last potential Upper and Lower levels are calculated using the previous two bars' price action. If the previous bar's low is lower than the low two bars ago and is equal to or greater than the low one bar ago, or if the previous bar's high is higher than the last potential Upper level, the last potential Upper level is set to the maximum of the previous bar's high and the high one bar ago. Otherwise, it is set to the last potential Upper level from the previous bar. The calculation for the last potential Lower level is similar, using the previous bar's high and low prices.
Finally, the indicator sets the plot brushes' colour based on the current trend: green for an uptrend, red for a downtrend, and grey for no trend.
Parameters
Plots
Upper (double): Represents the last momentum swing high level
Lower (double): Represents the last momentum swing low level