Fair Value Gap
Description
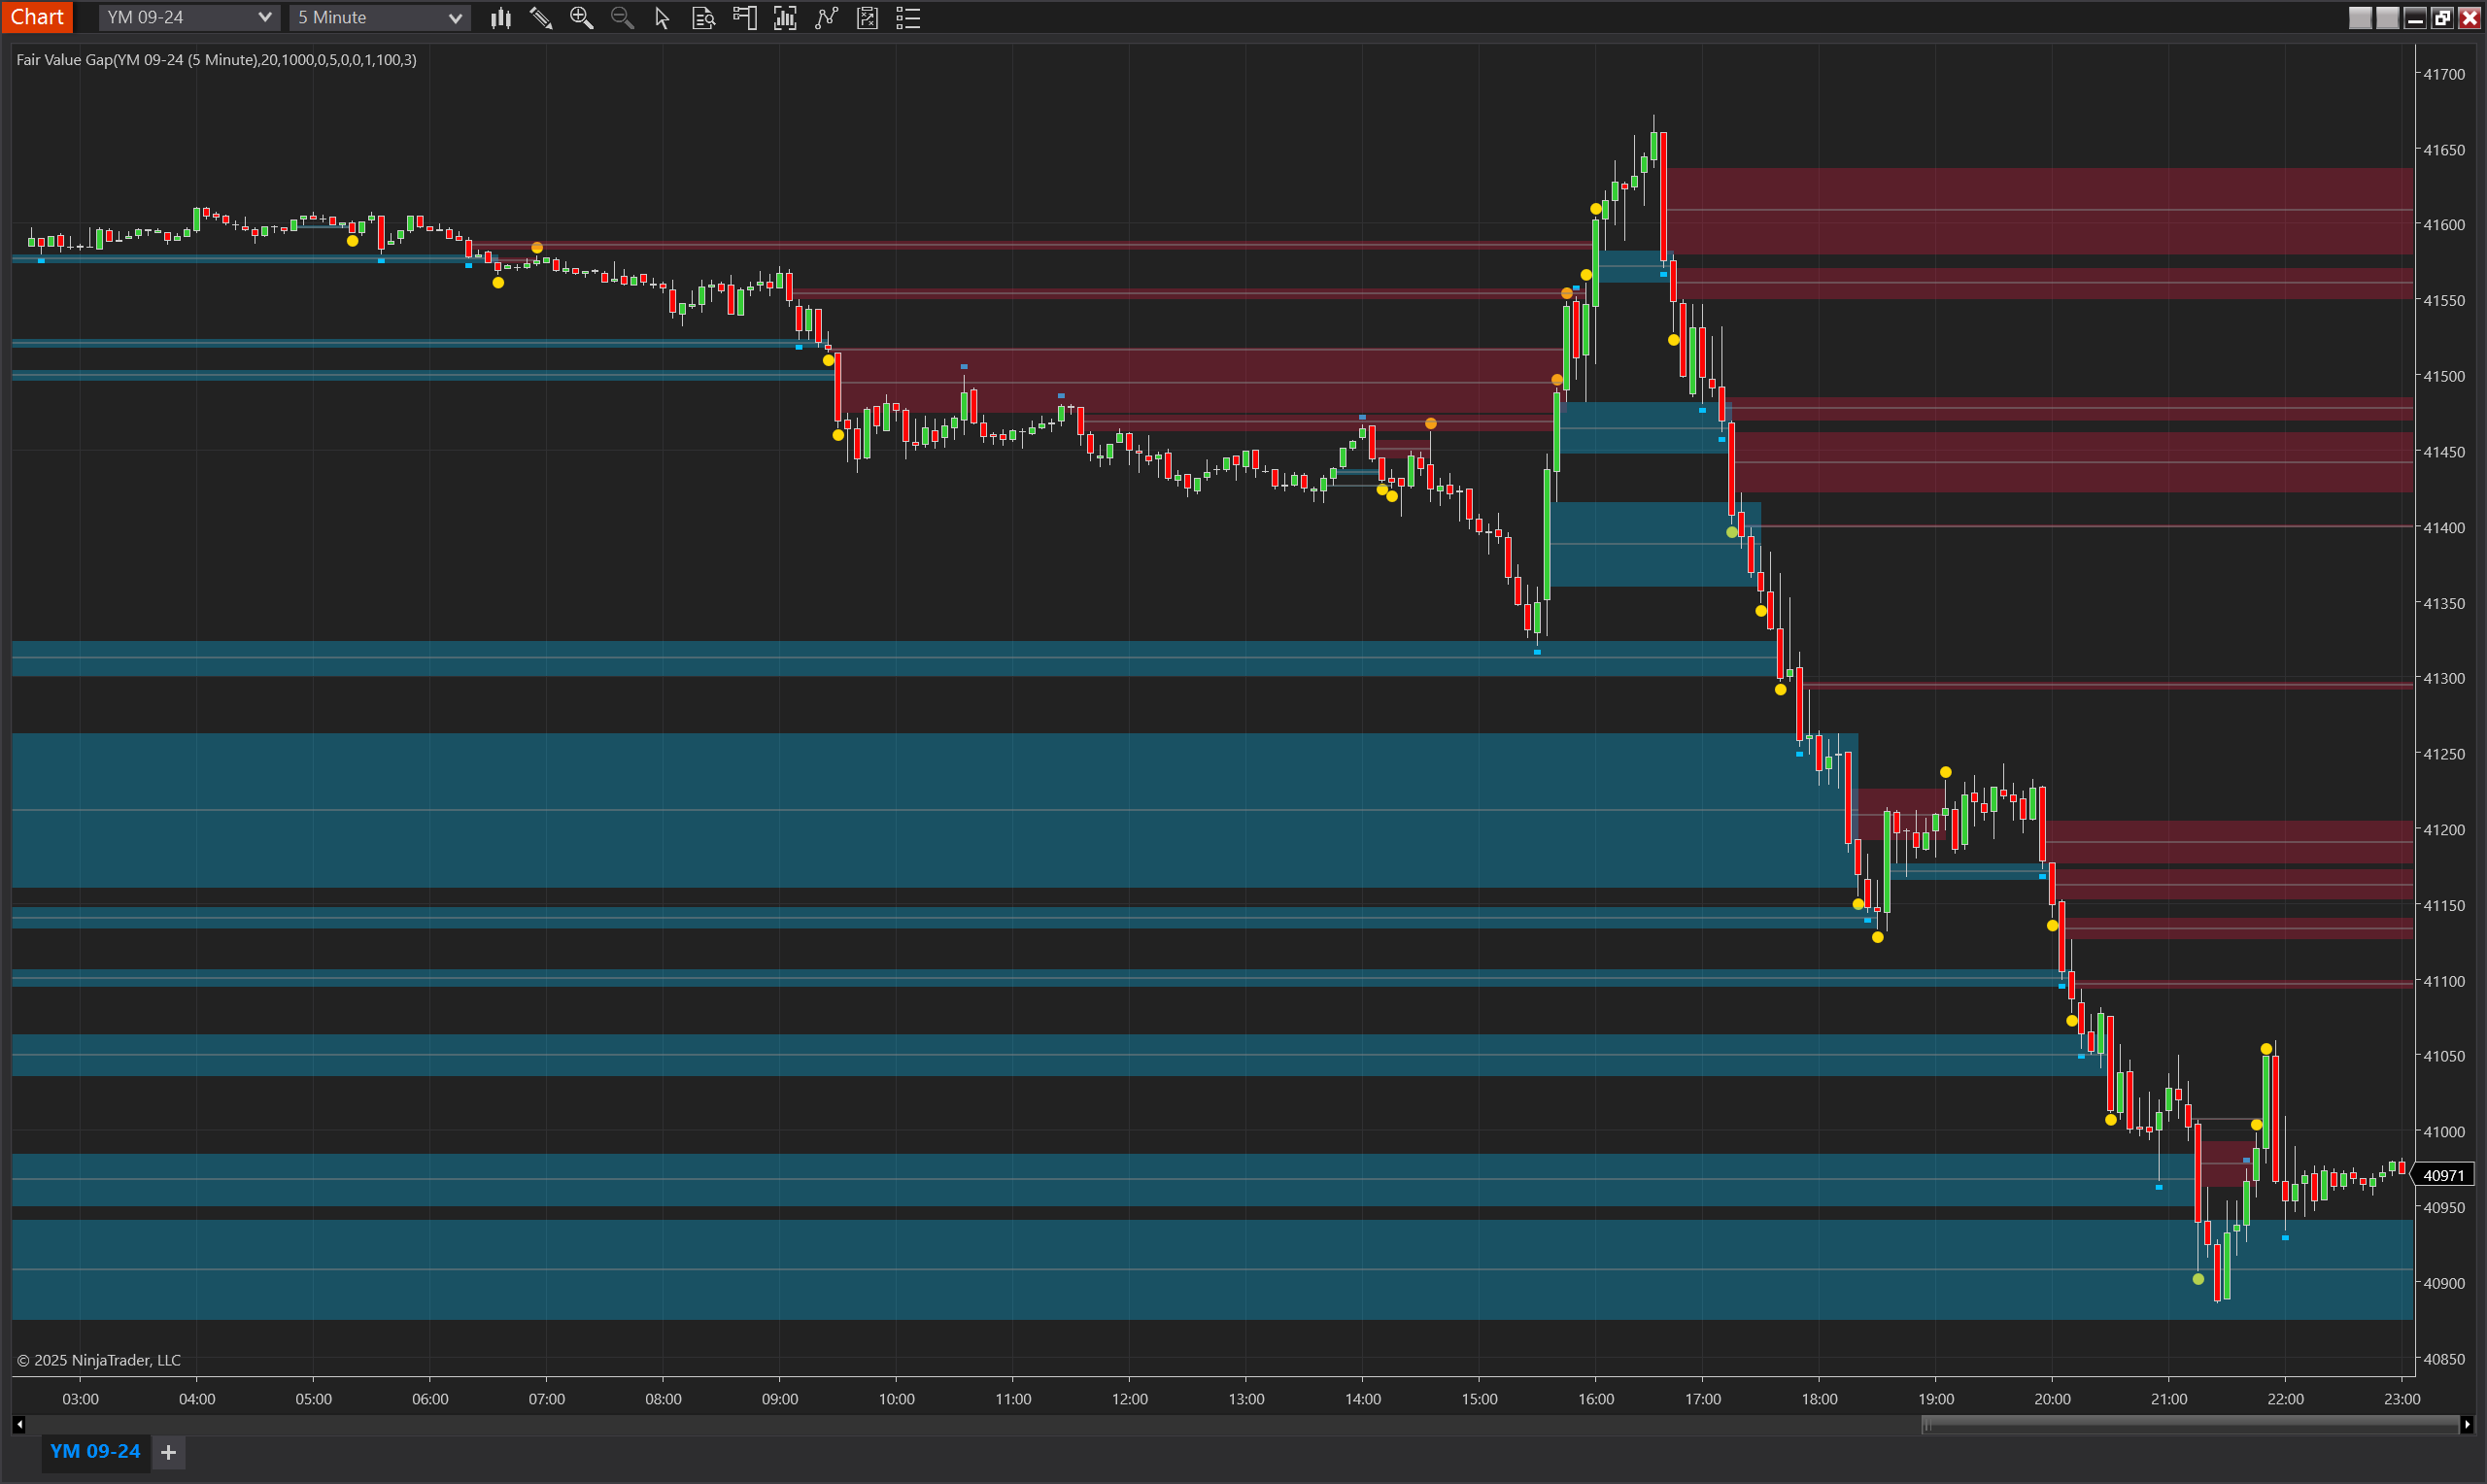
The Fair Value Gap (FVG) Indicator is a technical analysis tool designed to identify and track inefficiencies or imbalances in price action on a chart. These gaps occur when there is an absence of overlapping prices between the high of one candle and the low of another, typically within a three-candle pattern. This gap represents an area of market inefficiency where buying and selling forces were imbalanced, often acting as a magnet for price before the trend resumes in its original direction.
The FVG Indicator simplifies the process of identifying and monitoring these areas by automatically detecting fair value gaps and categorizing them into active, touched, or invalidated statuses. It ensures that only meaningful FVGs are considered by applying dynamic activation conditions, such as minimum bar counts and price movement thresholds, reducing false signals and improving trading precision.
This indicator is particularly popular among price action traders, as it provides a clear visual representation of fair value gaps using customizable zones and plots. By leveraging these features, traders can identify high-probability trading opportunities, confirm trend continuation or reversals, and enhance their overall market analysis.
Key Features
Automated Detection:
- Identifies FVGs based on the three-candle pattern.
- Differentiates between upward (bullish) and downward (bearish) FVGs.
Dynamic Activation:
- Activates FVGs only after conditions such as minimum bar count (MinBarsSinceFVG) and price thresholds (MinTicks) are satisfied.
Advanced Visualization:
- Highlights active FVG zones with customizable colors and opacity.
- Provides visual markers for touched and invalidated FVGs, ensuring clarity.
ATR and Range Filters:
- Validates FVG significance using ATR multiples, Donchian Channel ranges, and current day range percentages.
Customizable Parameters:
- Offers full control over FVG conditions, visualization, and expiration through session and bar-based tracking.
Support for Risk Management:
- Tracks FVG interactions, enabling traders to use them as dynamic support/resistance levels or for mean-reversion strategies.
Tips for Implementation
Strategic Use:
- Use the FVG Indicator to identify price imbalances as potential support or resistance levels.
- Pair FVGs with prevailing trend direction for continuation setups or counter-trend reversals.
Parameter Optimization:
- Adjust MinBarsSinceFVG and MinTicks for your trading style and timeframe.
- Use ATR and range-based filters (MinATRMultiple, MinRangePercent) for high-probability setups.
Visualization:
- Customize zone colors and opacity for clarity, especially when multiple FVGs are displayed.
Signal Confirmation:
- Combine FVG analysis with trend indicators (e.g., moving averages) or oscillators (e.g., RSI) for additional validation.
- Watch for price touching an FVG and reversing to confirm the imbalance's significance.
Backtesting:
- Test the indicator across various instruments to fine-tune parameters and evaluate performance in diverse market conditions.
Parameters
Min Bars Since FVG
- Type: int
- Description: Defines the minimum number of bars required after an FVG is identified before it is considered active.
- Default Value: 5
- Valid Values: Any positive integer greater than or equal to 1.
Min Ticks
- Type: int
- Description: Specifies the minimum price movement in ticks required for FVG activation.
- Default Value: 10
- Valid Values: Any non-negative integer.
Min ATR Multiple
- Type: int
- Description: Sets the minimum multiple of the Average True Range (ATR) that the FVG must exceed to be considered valid.
- Default Value: 0
- Valid Values: Any non-negative integer.
Min Range Percent
- Type: int
- Description: The minimum percentage of the Donchian Channel range that the FVG must exceed for activation.
- Default Value: 0
- Valid Values: Any non-negative integer.
Min Current Day Range Percent
- Type: int
- Description: Specifies the minimum percentage of the current day's range that the FVG must surpass for validation.
- Default Value: 0
- Valid Values: Any non-negative integer.
ATR Period
- Type: int
- Description: Defines the number of bars used to calculate the Average True Range (ATR) for FVG validation.
- Default Value: 20
- Valid Values: Any positive integer greater than or equal to 1.
Range DC Period
- Type: int
- Description: Sets the period for calculating the Donchian Channel range, which is used to assess broader price movements and refine gap analysis.
- Default Value: 100
- Valid Values: Any positive integer greater than or equal to 1.
Bars Validity
- Type: int
- Description: Determines how long (in bars) an FVG remains valid after its creation.
- Default Value: 200
- Valid Values: Any positive integer greater than or equal to 1.
Sessions Validity
- Type: int
- Description: Specifies the number of sessions an FVG remains valid before being automatically invalidated.
- Default Value: 1
- Valid Values: Any positive integer greater than or equal to 1.
Zone Opacity
- Type: int
- Description: Adjusts the opacity of the FVG zones displayed on the chart, where 1 is fully transparent and 100 is fully opaque.
- Default Value: 30
- Valid Values: Any integer from 1 to 100.
Level Width
- Type: int
- Description: Sets the line thickness for marking FVG levels on the chart.
- Default Value: 1
- Valid Values: Any positive integer greater than or equal to 1.
Plot Offset
- Type: int
- Description: The distance (in ticks) from the bar high/low to position FVG-related plots for better visibility.
- Default Value: 5
- Valid Values: Any positive integer.
Plots
UpperTouch
- Type: Hash
- Style: Solid Line
- Color: DeepSkyBlue
- Description: Indicates when price touches the upper boundary of a bullish FVG. This highlights potential resistance levels where price may react.
LowerTouch
- Type: Hash
- Style: Solid Line
- Color: DeepSkyBlue
- Description: Indicates when price touches the lower boundary of a bearish FVG. This highlights potential support levels where price may react.
UpperInvalidatedZone
- Type: Dot
- Style: Dotted Line
- Color: Gold
- Description: Marks upper FVG zones that have been invalidated, signaling that the imbalance is no longer active as a resistance area.
LowerInvalidatedZone
- Type: Dot
- Style: Dotted Line
- Color: Gold
- Description: Marks lower FVG zones that have been invalidated, signaling that the imbalance is no longer active as a support area.