Fractal Structure HL
Description
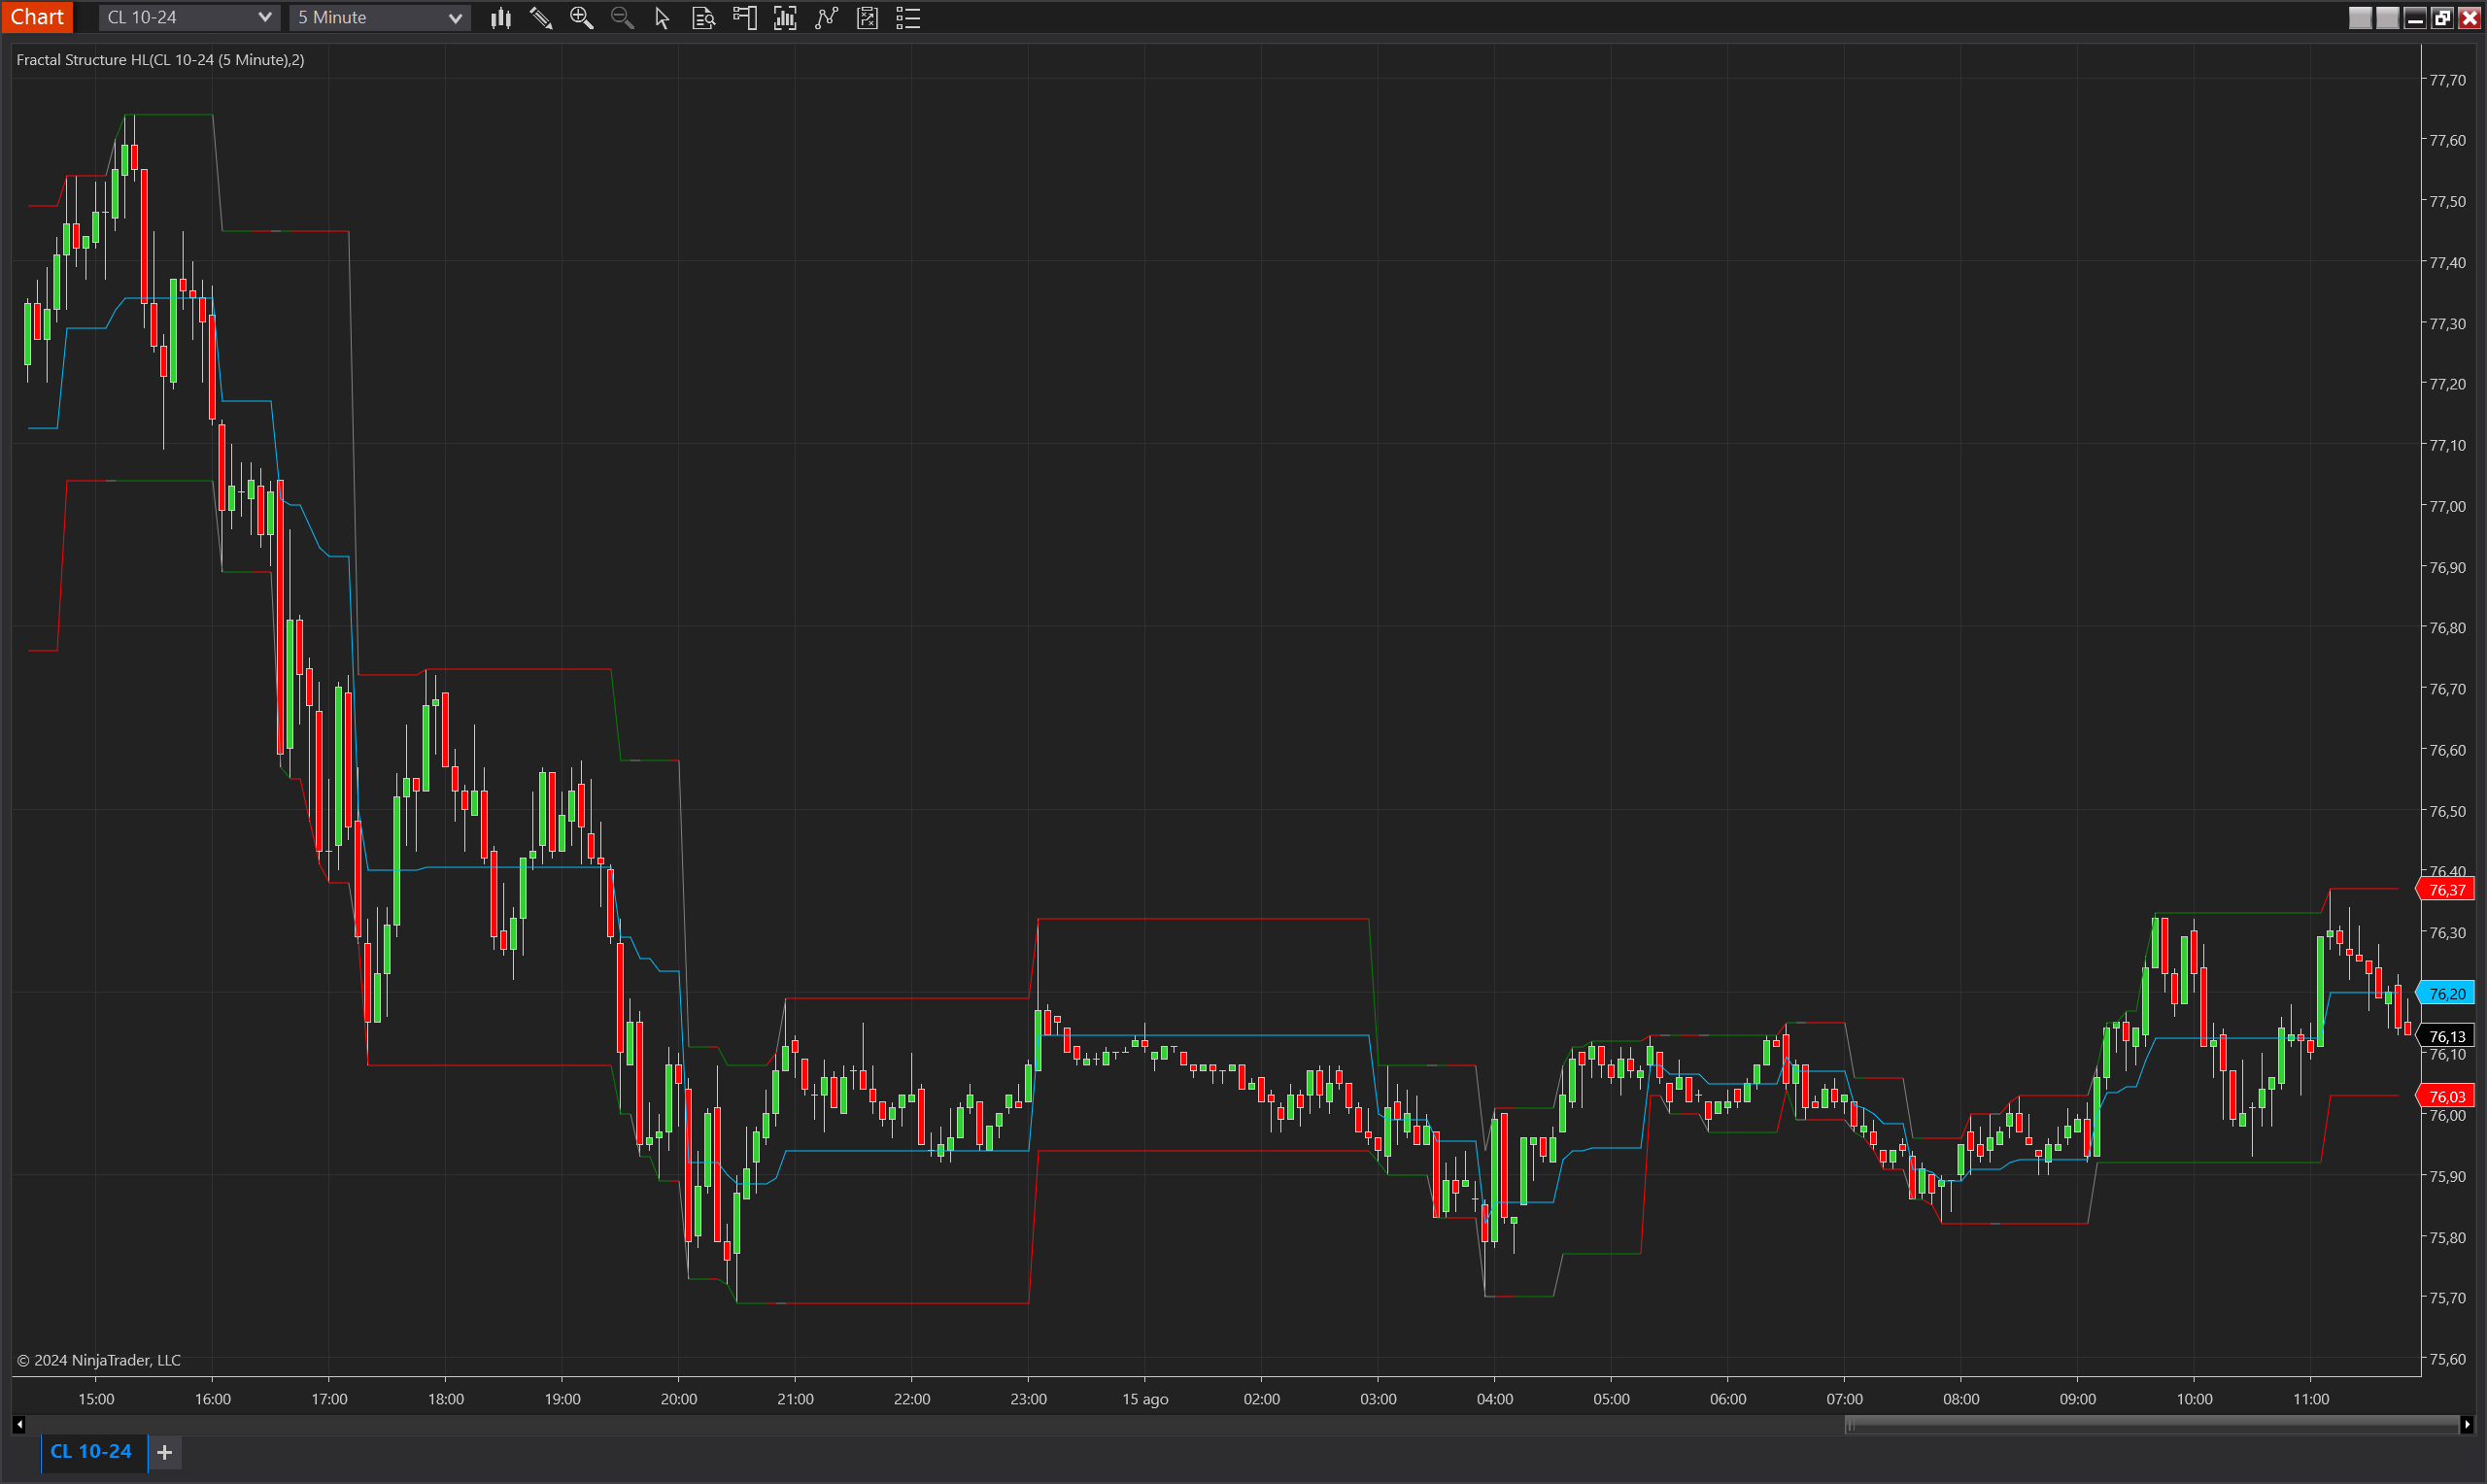
The Fractal Structure HL is a technical analysis indicator designed for NinjaTrader 8. It identifies key price levels by analyzing fractal structures within the market, which helps traders understand potential support and resistance zones. The indicator plots Upper, Lower, and Mean levels based on recent highs and lows, providing insights into the market's trend direction and potential breakout levels. The unique structure of this indicator allows it to detect price movements and trends that might be overlooked by traditional indicators, offering traders a more nuanced view of the market.
This indicator is especially useful in identifying trend reversals and confirming the strength of existing trends by continuously monitoring fractal structures. Traders can use it to enhance their entry and exit strategies, ensuring that they align with significant price levels and market trends.
Key Features:
- Fractal Detection: The indicator identifies both upper and lower fractal levels, marking significant price points where the market may reverse or accelerate.
- Trend Identification: By calculating and plotting trend direction based on fractal breakouts, the indicator helps traders stay aligned with the market's momentum.
- Customizable Visualization: Users can adjust the colors of the trend indicators (uptrend, downtrend, no trend) to match their chart preferences.
Tips for Implementation:
- Strategic Confirmation: Use the indicator to confirm entries at significant fractal levels, especially when these align with broader market support or resistance zones.
- Volatility Filters: Pair with volatility measures such as Bollinger Bands or ATR to filter out signals during low-volatility periods, which may result in false breakouts.
- Parameter Adjustment: Customize the Continuation Closes parameter to match the timeframe of your trading strategy, ensuring the indicator's sensitivity aligns with your trading style.
- Complementary Indicators: Combine with trend-following indicators like moving averages or momentum oscillators to corroborate signals and reduce the likelihood of false entries.
- Backtesting: Thoroughly backtest the indicator across various market conditions to determine its effectiveness in your trading system and to fine-tune the settings for optimal performance.
Parameters
Continuation Closes:
- Type: int
- Description: Defines the number of consecutive closes above or below a breakout level required to confirm a trend.
- Default Value: 2
- Valid Values: 1 and above
Trend Up Color:
- Type: Brush
- Description: The color used to indicate an uptrend on the chart.
- Default Value: Green
Trend Down Color:
- Type: Brush
- Description: The color used to indicate a downtrend on the chart.
- Default Value: Red
No Trend Color:
- Type: Brush
- Description: The color used to indicate a neutral or no trend situation on the chart.
- Default Value: Gray
Plots
Upper:
- Type: Plot
- Style: Solid Line
- Color: DeepSkyBlue
- Description: Represents the upper fractal level, indicating a potential resistance point or the peak of a trend.
Lower:
- Type: Plot
- Style: Solid Line
- Color: DeepSkyBlue
- Description: Represents the lower fractal level, indicating a potential support point or the trough of a trend.
Mean:
- Type: Plot
- Style: Solid Line
- Color: DeepSkyBlue
- Description: The average of the Upper and Lower levels, providing a mid-point reference that can act as a dynamic support/resistance level.