DC Strong Closes Trend
Description
The "DC Strong Closes Trend" indicator identifies and tracks market trends based on the behavior of price action relative to the Donchian Channel's boundaries. It specifically looks for initiation points where the price strongly closes above the upper or below the lower channel, indicating potential beginnings of new trends. The trend is considered active until the low of the first breakout bar is violated or if the price fails to produce two consecutive strong closes, thus suggesting a weakening or reversal of the trend.
Key Features
- Trend Identification: Utilizes the Donchian Channel to determine potential trend starts with two consecutive strong closes breaking out of the channel's upper or lower bounds.
- Trend Confirmation and Termination: A trend is confirmed if the price continues to make strong closes outside the channel. It terminates if a close reverts within the channel or fails to make a new high or low, suggesting a potential pullback or reversal.
- Adaptive to Market Conditions: By adjusting the period of the Donchian Channel, the indicator can be tuned for different market conditions, shorter periods for a more reactive trend analysis, or longer periods for more significant trend confirmation.
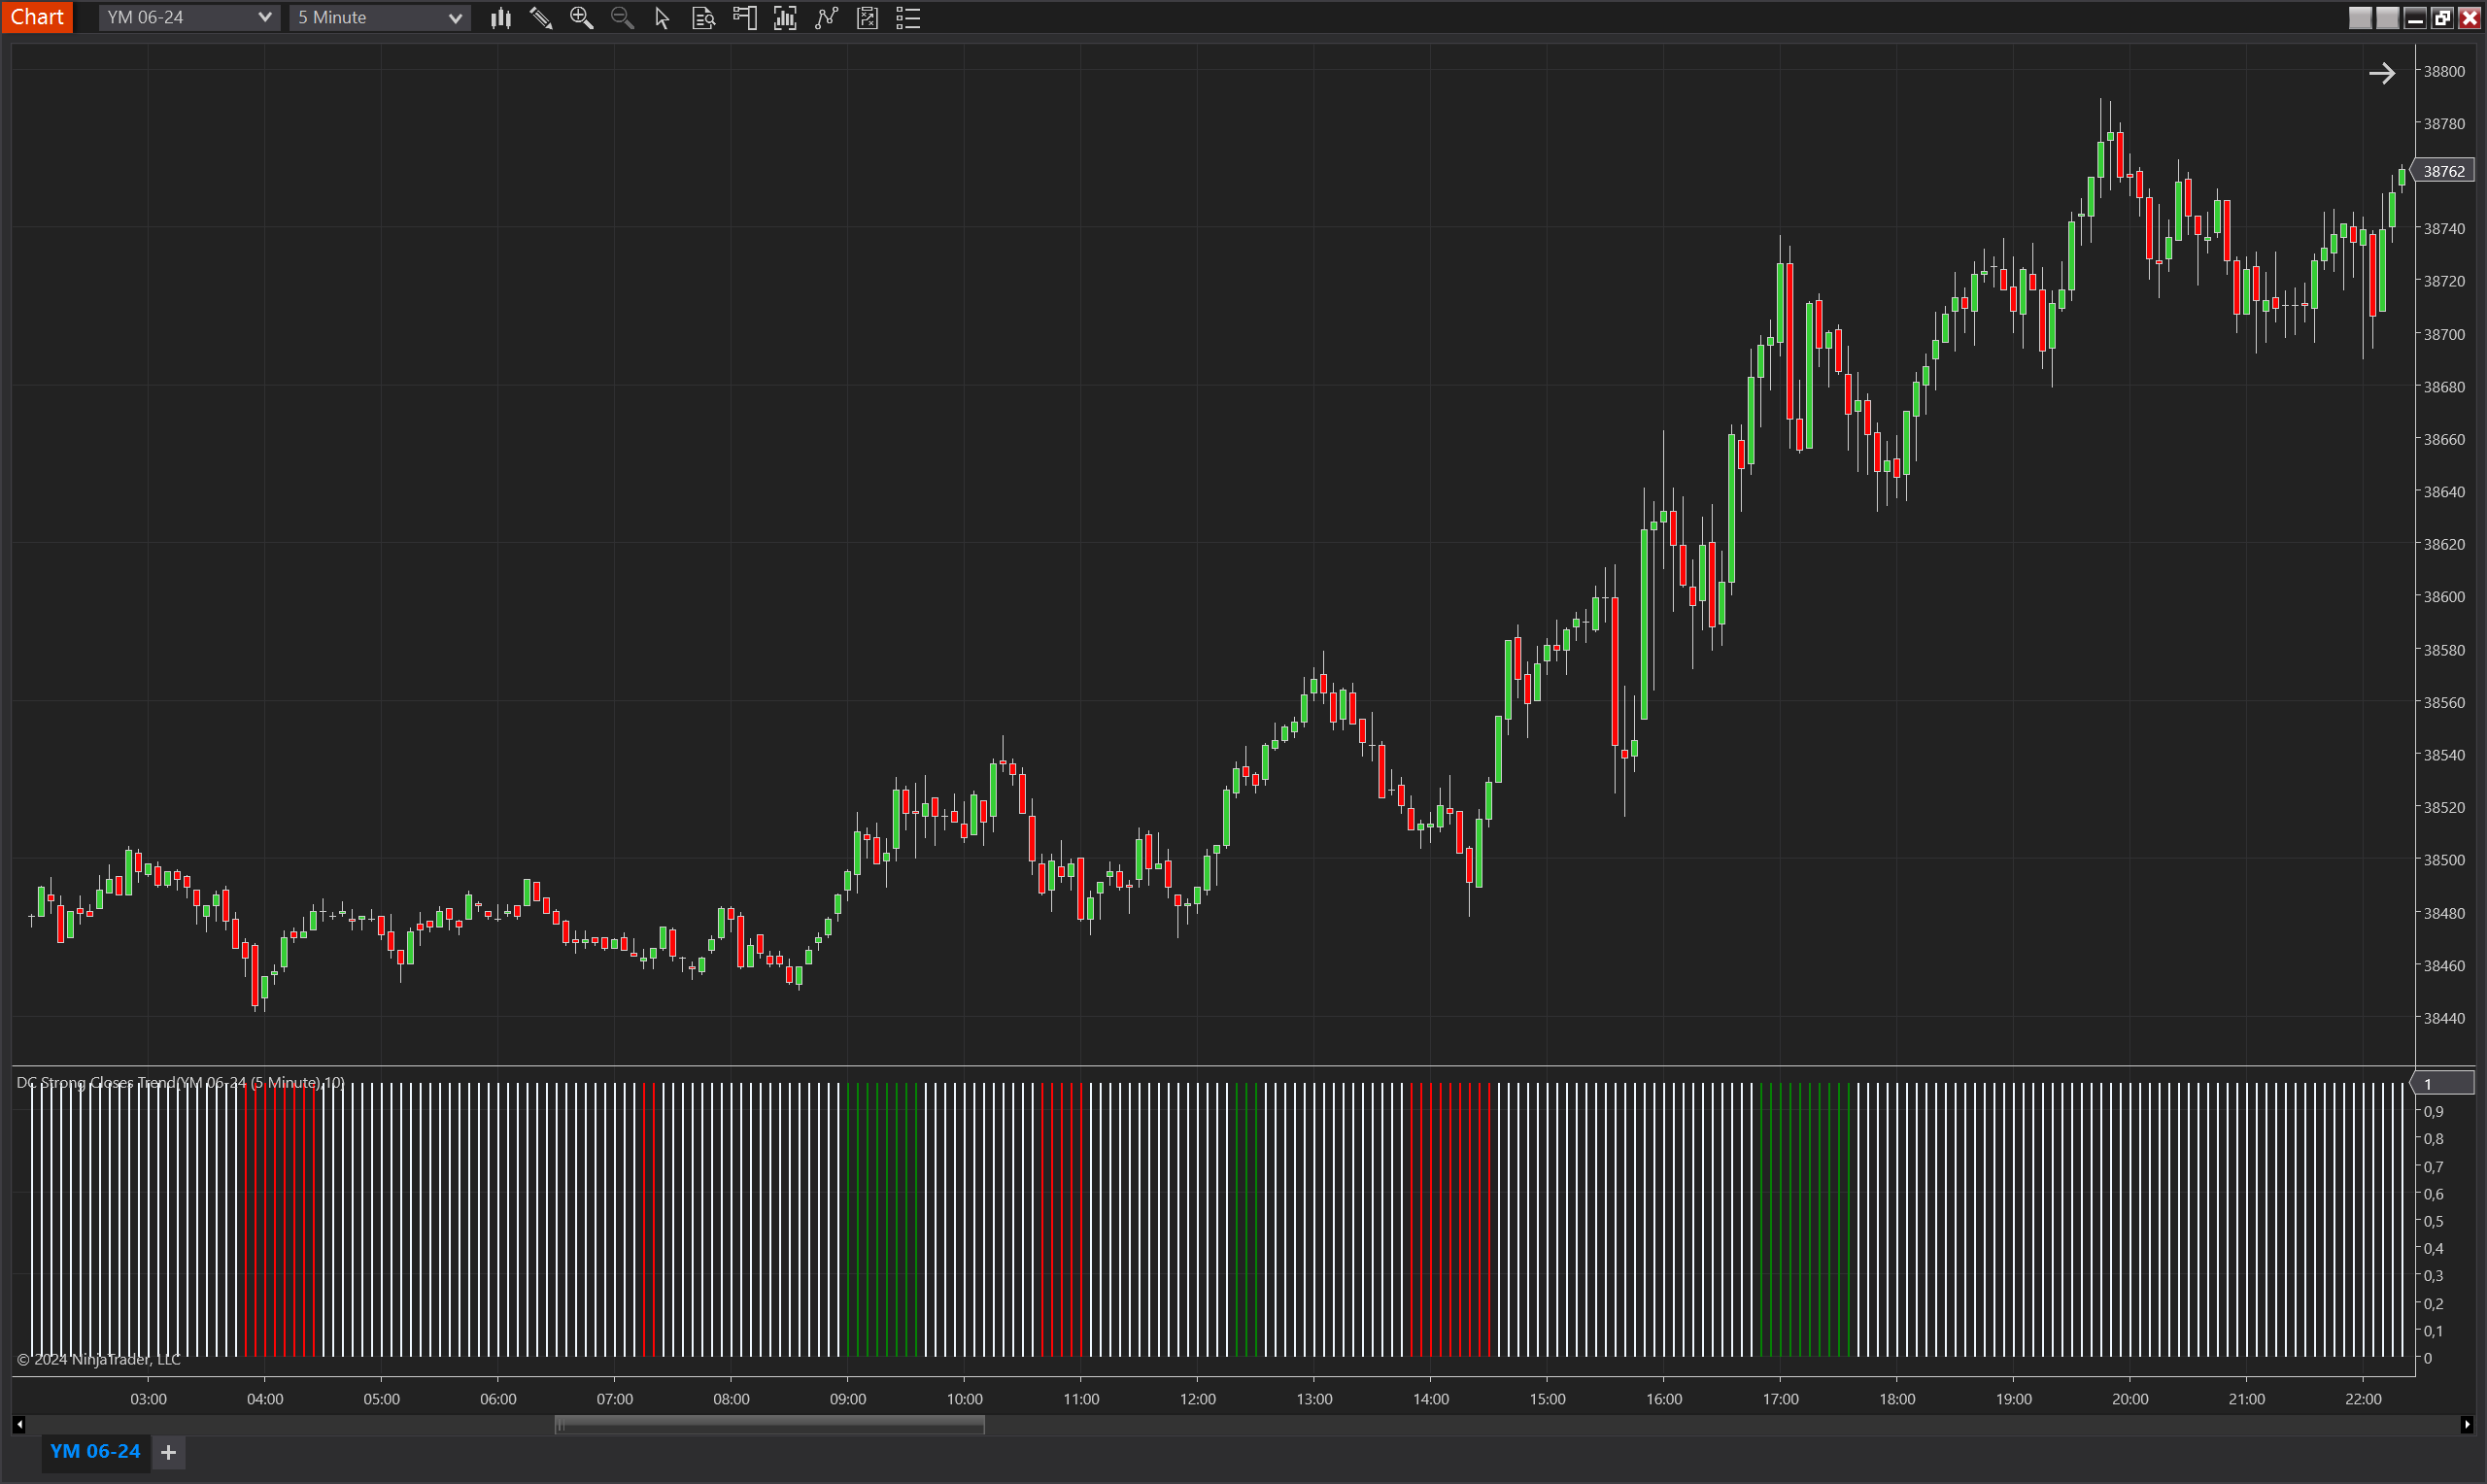
- Visual Trend Indicators: Uses color-coded plots to visually represent the trend's direction—green for upward trends, red for downward trends, and blue for neutral/no trend conditions.
Tips for Implementation
- Setting Parameters: The Period parameter of the Donchian Channel is crucial as it defines the sensitivity of the trend detection. Shorter periods may result in more frequent trend changes and noise, while longer periods may delay the recognition of trend changes but could filter out minor fluctuations.
- Risk Management: Incorporate stops based on violations of the lows of breakout bars or when the price closes back within the Donchian Channel after a breakout. This method helps in managing risk by providing clear conditions for trend invalidation.
- Combining Indicators: Pair this indicator with volume indicators to confirm breakout strength or with momentum indicators to verify the strength of the trend. This can help in distinguishing false breakouts from genuine trend changes.
- Backtesting: It is advisable to backtest the indicator under various market conditions to understand its behavior and tweak parameters accordingly before applying it to live trading scenarios.
By focusing on the price's relation to the Donchian Channel and monitoring the strength of closes relative to this channel, the "DC Strong Closes Trend" indicator provides a structured approach to trend following, making it a valuable tool for traders looking to capitalize on sustained price movements.
Parameters
TrendUp:
- Style: Bar
- Color: Green
- Description: Indicates the presence of an upward trend as identified by the indicator. A green bar is plotted when the price action strongly closes above the Donchian Channel's upper boundary and continues to exhibit strength, signifying bullish momentum.
TrendDown:
- Style: Bar
- Color: Red
- Description: Represents the presence of a downward trend. A red bar is plotted when the price action strongly closes below the Donchian Channel's lower boundary and continues to move downward, signifying bearish momentum.
NoTrend:
- Style: Bar
- Color: Alice Blue
- Description: This plot indicates a lack of a clear trend or a neutral market condition where the price does not exhibit consecutive strong closes outside of the Donchian Channel, or the previous breakout levels have been invalidated, leading to a consolidation or indecision phase.