BB SMA Trend
Description
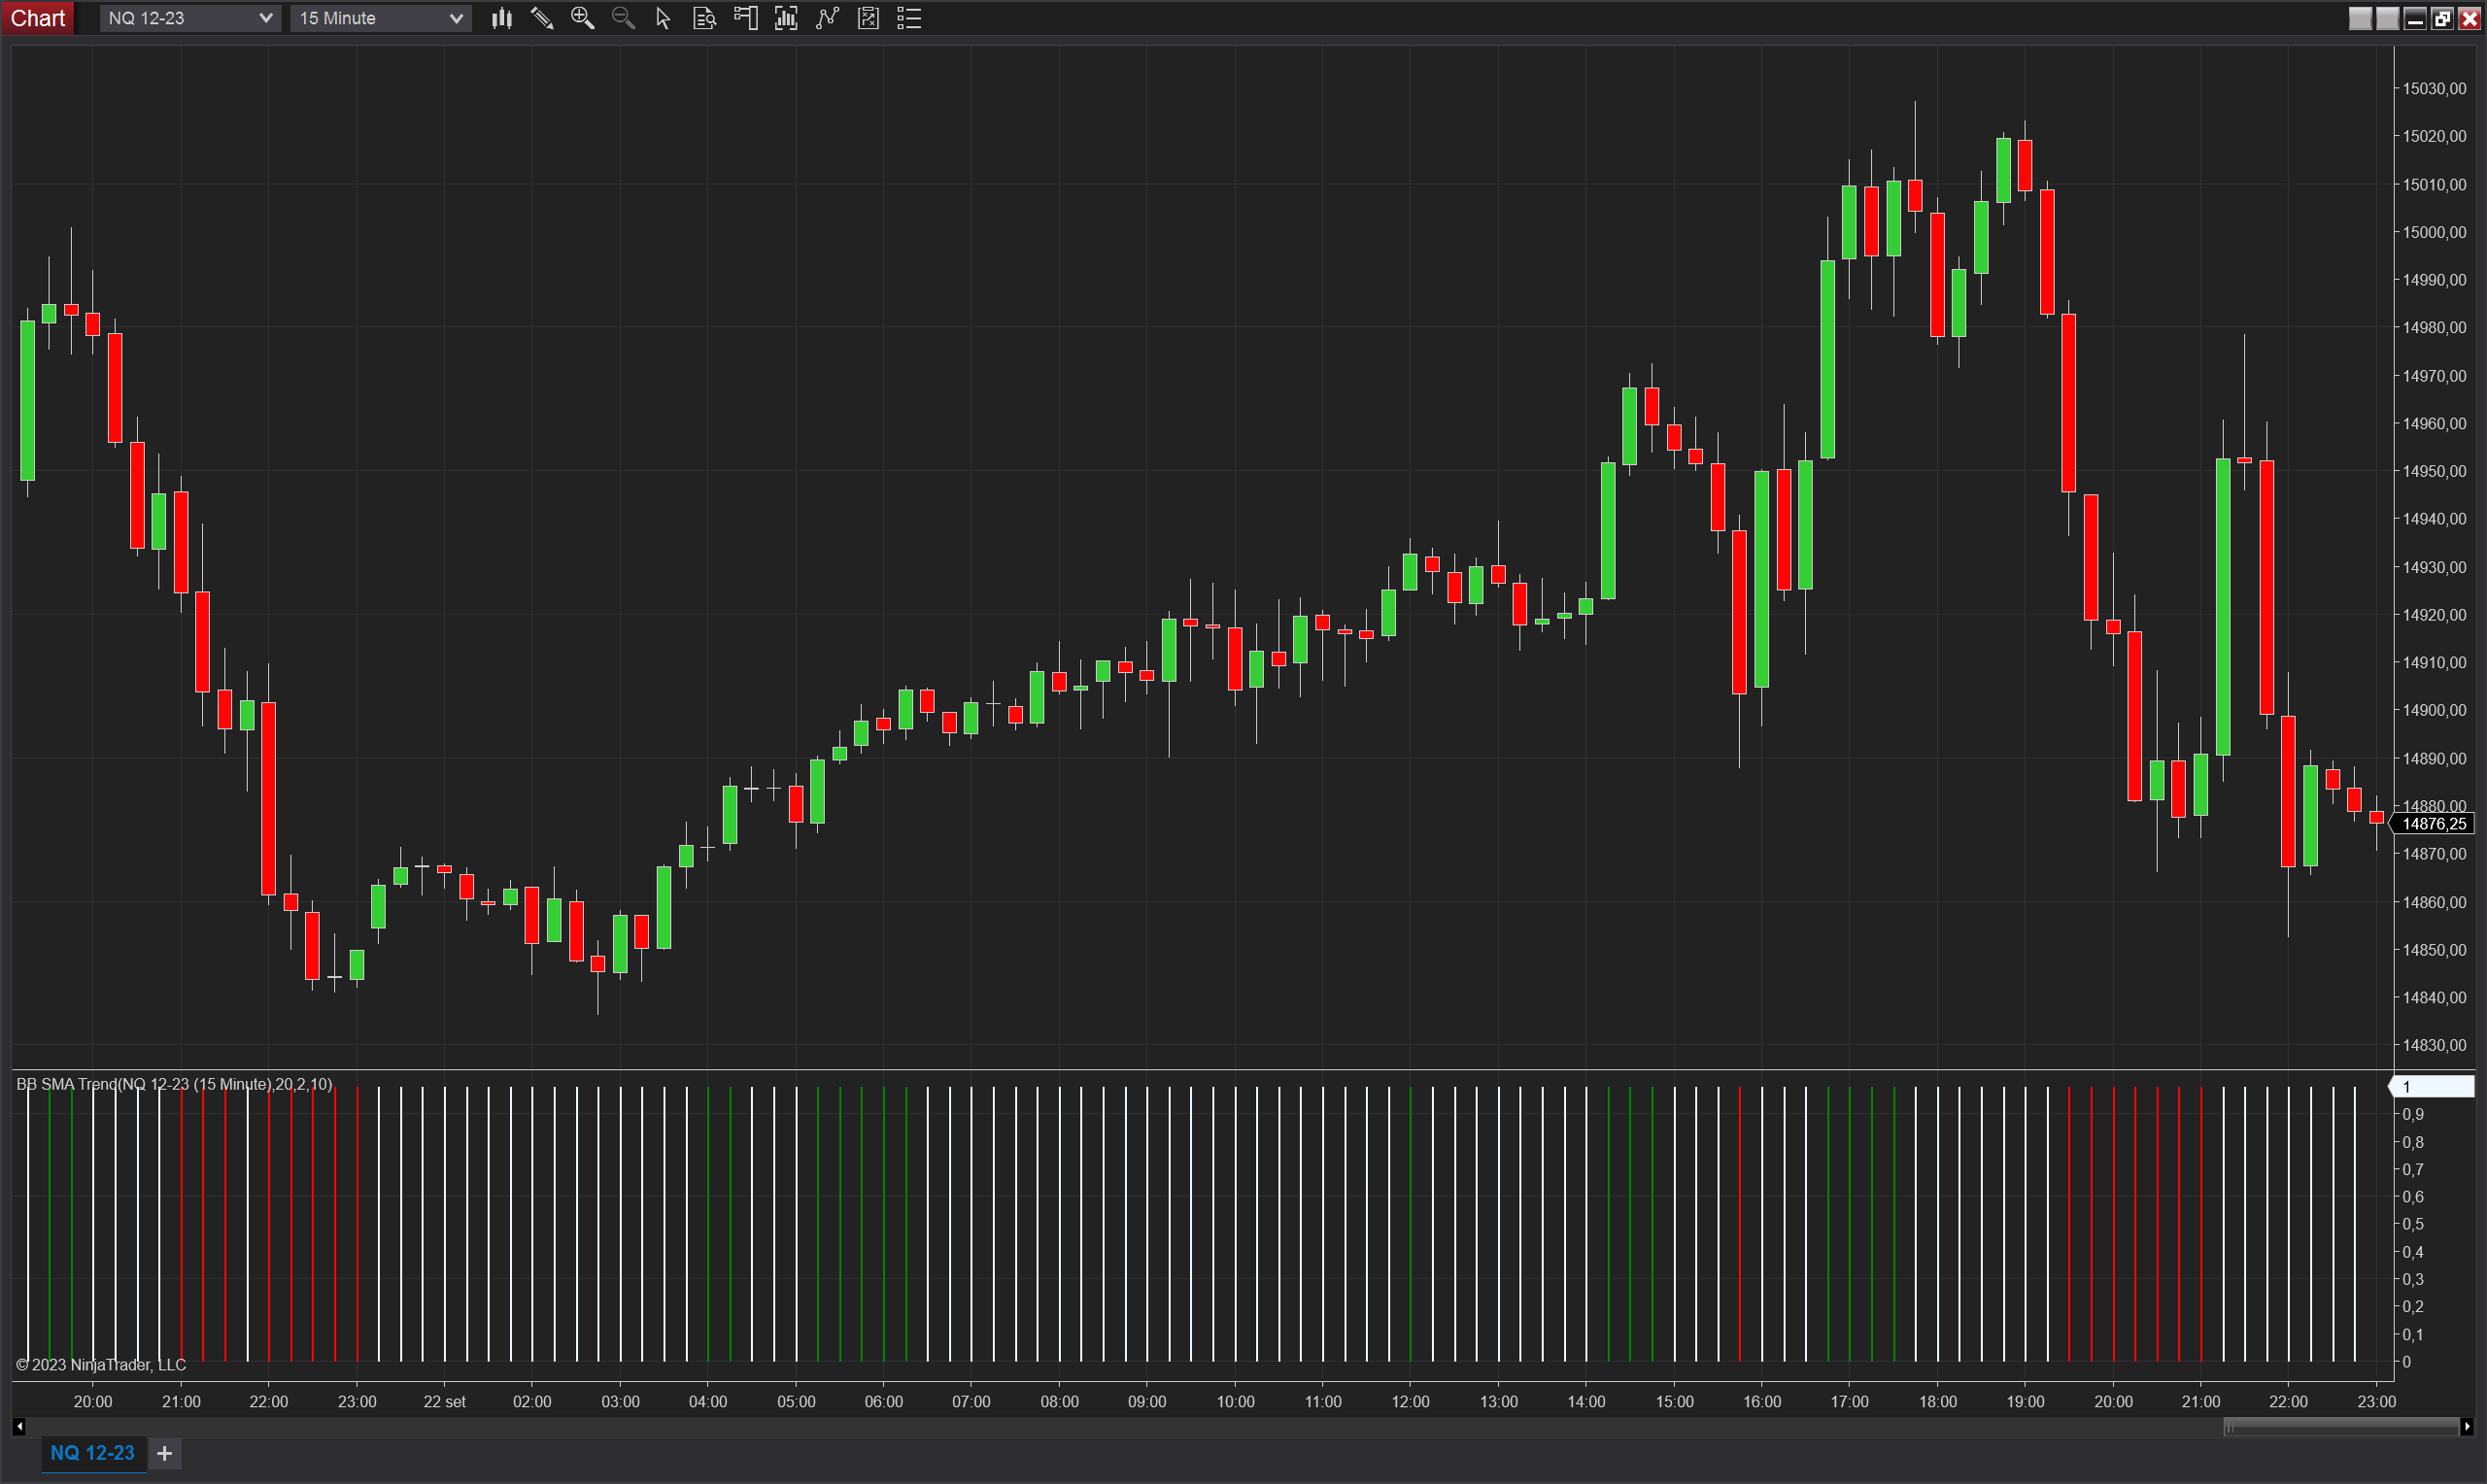
The BB SMA Trend indicator is a powerful tool for NinjaTrader 8 designed to assist traders in identifying trends in the financial markets. This indicator utilizes the Bollinger Bands and a Simple Moving Average (SMA) to determine the prevailing trend direction. By analyzing the relationship between these two technical indicators, the BB SMA Trend indicator provides valuable insights into market momentum, helping traders make more informed trading decisions.
The BB SMA Trend indicator employs a straightforward logic to determine trend direction:
Bollinger Bands (BB): The Bollinger Bands consist of three lines – the middle band (SMA), the upper band, and the lower band. The upper and lower bands represent volatility around the SMA.
Simple Moving Average (SMA): The Simple Moving Average is a commonly used trend-following indicator that calculates the average price over a specified period.
The BB SMA Trend indicator relies on the interaction between these two components to identify trends:
Uptrend: To confirm an uptrend, the Bollinger Bands must open or widen (indicating increased volatility), and the closing price should be above the SMA.
Downtrend: To confirm a downtrend, the Bollinger Bands must open or widen, and the closing price should be below the SMA.
Parameters
- BB Period: Defines the number of periods used to calculate the Bollinger Bands. A higher value smooths out the bands, while a lower value makes them more responsive to recent price movements.
- BB Std Dev: Sets the standard deviation multiplier for the bans. A higher value increases band width, while a lower value narrows it.
- SMA Period: Specifies the number of periods used to calculate the Simple Moving Average. Altering this parameter can impact the indicator's sensitivity to trend changes.
Plots
- TrendUp (double): 1 if the trend is up (otherwise 0).
- TrendDown (double): 1 if the trend is down (otherwise 0).
- NoTrend (double): 1 if there is no trend (otherwise 0).