Prior Day Max Average Bar Body
Description
The Prior Day Max Average Bar Body indicator calculates the maximum average range and maximum average body range of price bars relative to the prior trading day. It provides insights into historical price movement and helps traders assess market volatility. This indicator is particularly useful for identifying periods of high or low volatility, helping traders make informed trading decisions. When volatility is low compared to the previous day, traders may choose to avoid trading or adjust their strategy to a mean reversion approach. Conversely, high volatility compared to the prior day may indicate potential breakout opportunities.
⚠️ Note: This indicator works only on intraday timeframes.
How It Works
- Tracks the highest average range of bars over a user-defined period.
- Tracks the highest average body range of bars over the same period.
- Updates the maximum values at the start of a new trading session.
Use Cases
- Trend & Volatility Confirmation: Identify when the market is expanding or contracting in volatility.
- Stop-Loss & Take-Profit Optimization: Use max range values to set dynamic stop-loss and profit targets.
- Range Breakout Trading: Detect significant movements by monitoring changes in the max average range.
- Adaptive Trading Strategies: Adjust trading parameters based on the prior day's volatility.
Tips for Implementation
- Use for Trade Timing Decisions – If the current day's volatility is significantly lower than the prior day, traders may choose to avoid trading.
- Pair with Breakout Strategies – High volatility compared to the prior day suggests strong market movement, increasing the likelihood of breakouts.
- Optimize Mean Reversion Strategies – When volatility is low, range-bound strategies may perform better than trend-following strategies.
- Combine with ATR or Bollinger Bands – Using this indicator with ATR (Average True Range) or Bollinger Bands can help confirm volatility conditions.
- Backtest to Fine-Tune Thresholds – Traders should experiment with different threshold levels to determine when to trade and when to stay out.
Parameters
Period
- Type: int
- Description: Defines the number of bars used to calculate the average range and body range.
- Default Value: 20
- Valid Values: 1 and above
Plots
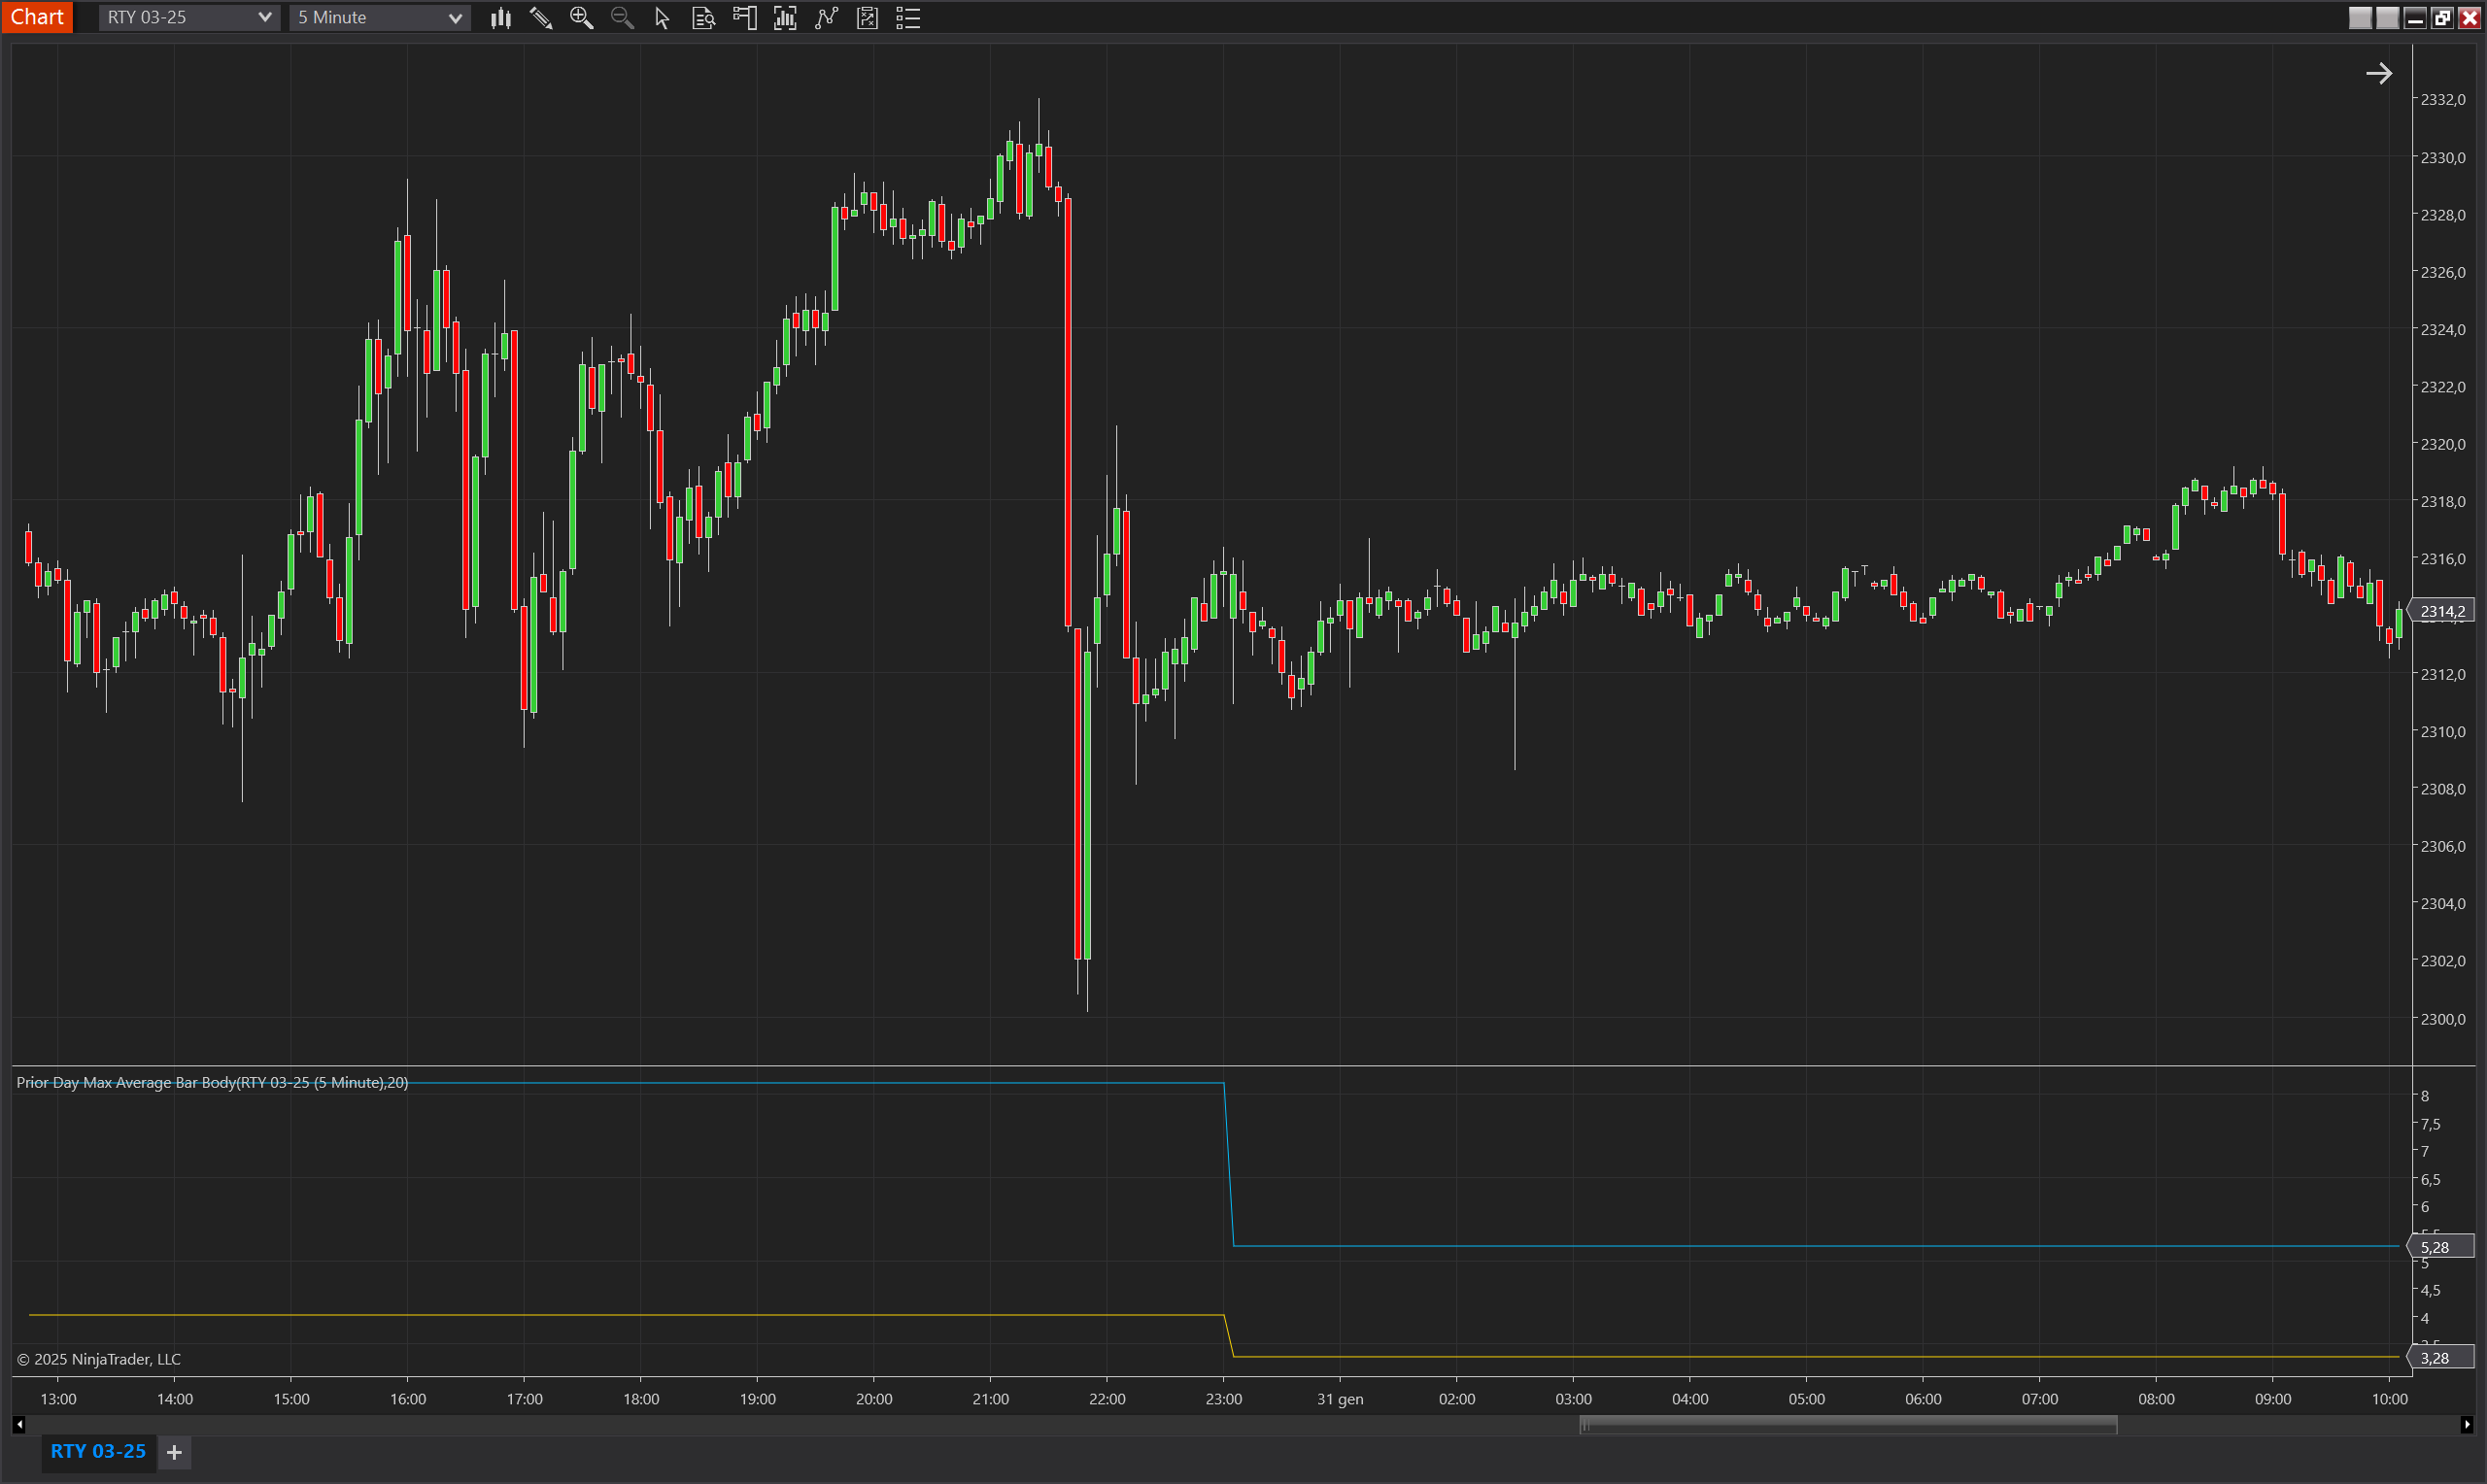
MaxBarAverageRange
- Type: Plot
- Style: Solid Line
- Color: DeepSkyBlue
- Description: Represents the maximum average range of price bars for the prior day. It indicates the highest volatility level over a defined period.
MaxBodyAverageRange
- Type: Plot
- Style: Solid Line
- Color: Gold
- Description: Represents the maximum average body range of price bars for the prior day. It highlights the largest price movement excluding wicks.
BarAverageRange
- Type: Plot
- Style: Solid Line
- Color: DeepSkyBlue
- Description: Represents the current average range of the price bars calculated over the defined period. This value provides insights into the current volatility compared to the maximum range values of the prior day.
BodyAverageRange
- Type: Plot
- Style: Solid Line
- Color: Gold
- Description: Represents the current average body range of the price bars calculated over the defined period. It highlights the current price action's internal movement compared to the maximum body range values of the prior day.