Fair Value Gap Range Sum
Description
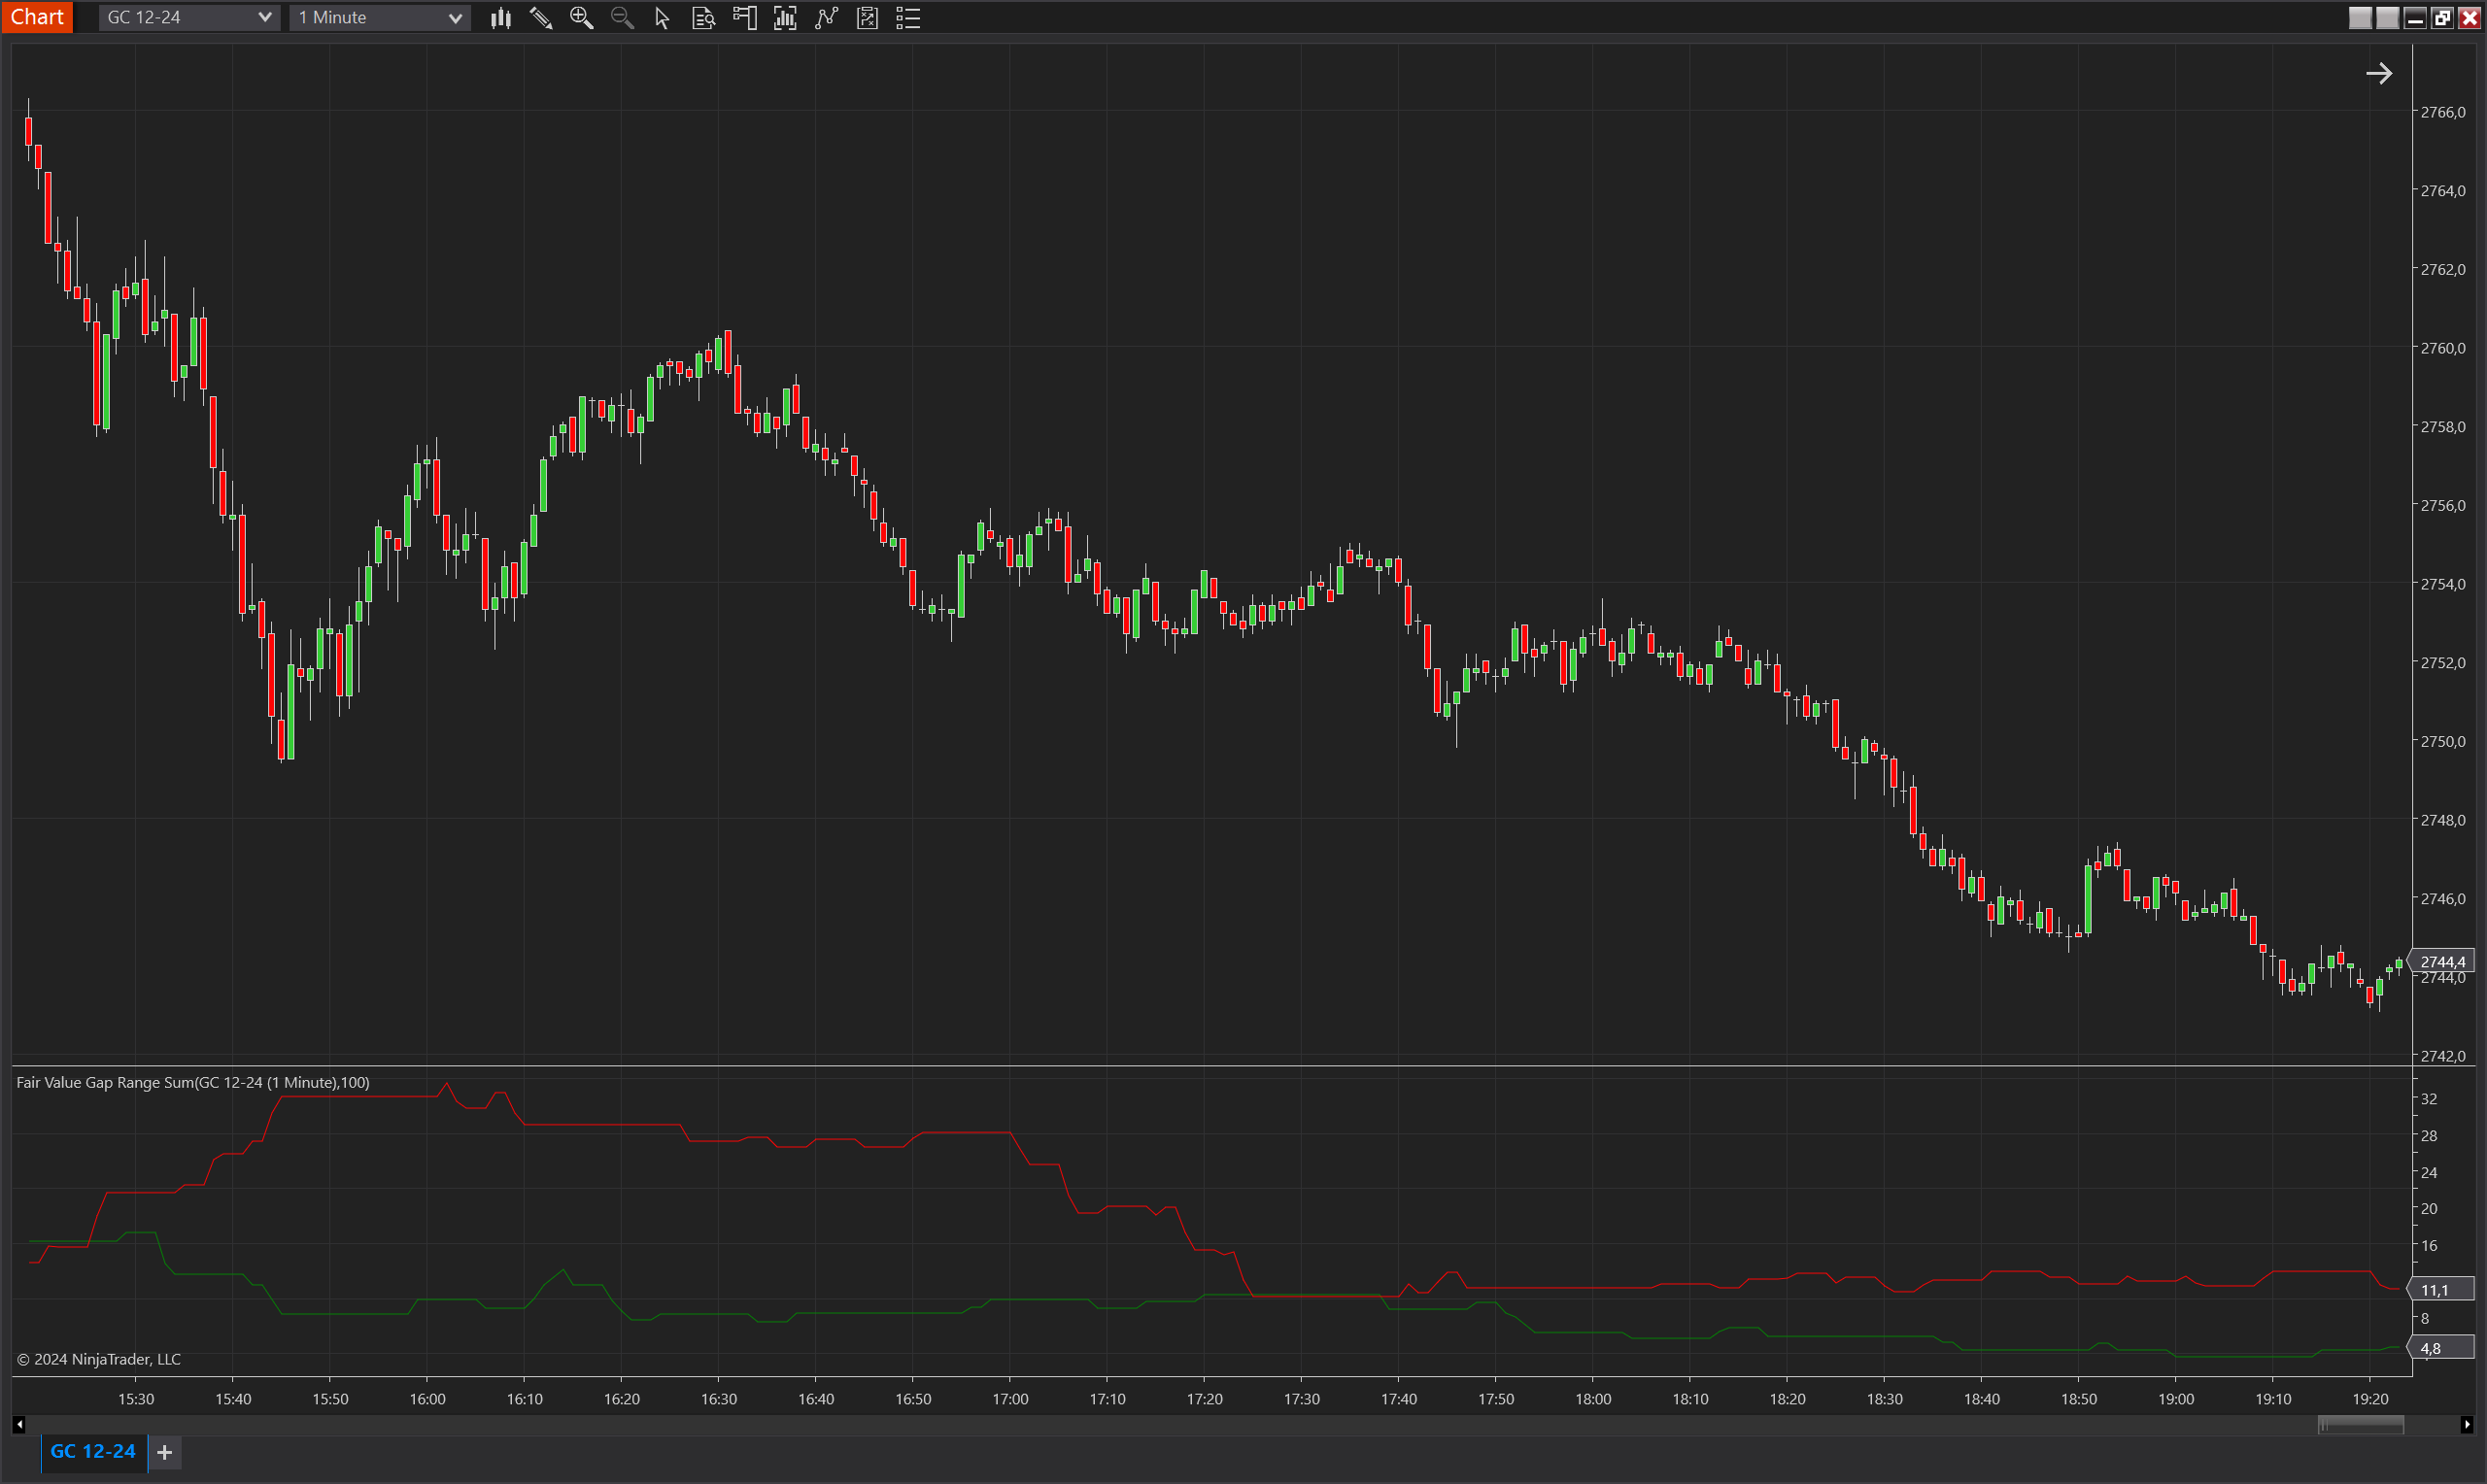
The Fair Value Gap (FVG) Range Sum indicator for NinjaTrader 8 is designed to measure and plot the cumulative range of detected fair value gaps (FVGs) over a user-defined period. This indicator aids traders in identifying significant market imbalances that may signal potential price corrections or trading opportunities. By summing the sizes of all FVGs within the selected period, it provides a comprehensive view of market discrepancies that can lead to strategic trading decisions.
Key Features
- Cumulative FVG Measurement: Computes and accumulates the range of detected FVGs for both upward (bullish) and downward (bearish) trends.
- Dynamic Market Analysis: Offers insights into potential market corrections by highlighting areas with significant FVG sums.
- Customizable Period: The period parameter allows traders to adjust how many bars are used in the calculation, enabling flexibility across different timeframes and asset types.
- Visual Representation: Plots separate series for upward and downward FVG sums to enhance clarity and ease of interpretation.
- Supports Multiple Strategies: Can be used to identify areas of potential retracement or continuation, depending on the cumulative FVG behavior.
Tips for Implementation
- Parameter Adjustment: Modify the Period parameter to align with your trading style. Shorter periods can highlight immediate imbalances, while longer periods provide a broader view of the market's historical behavior.
- Combining with Other Indicators: Use in conjunction with trend-following or momentum indicators to confirm the significance of detected FVGs and improve signal reliability.
- Monitoring FVG Ratios: Consider observing the ratio between ValueUp and ValueDown to understand the prevailing market bias.
- Backtesting and Optimization: Ensure thorough backtesting to determine the most effective period settings and confirm the indicator’s behavior across various market conditions.
Parameters
Period:
- Type: int
- Description: Number of bars used for calculating the cumulative FVG range sums.
- Default Value: 100
- Valid Values: Any positive integer
Plots
ValueUp:
- Type: Plot
- Style: Line
- Color: Green
- Description: Represents the cumulative range sum of upward (bullish) fair value gaps detected within the specified period.
ValueDown:
- Type: Plot
- Style: Line
- Color: Red
- Description: Represents the cumulative range sum of downward (bearish) fair value gaps detected within the specified period.