Bar EMA Distance
Description
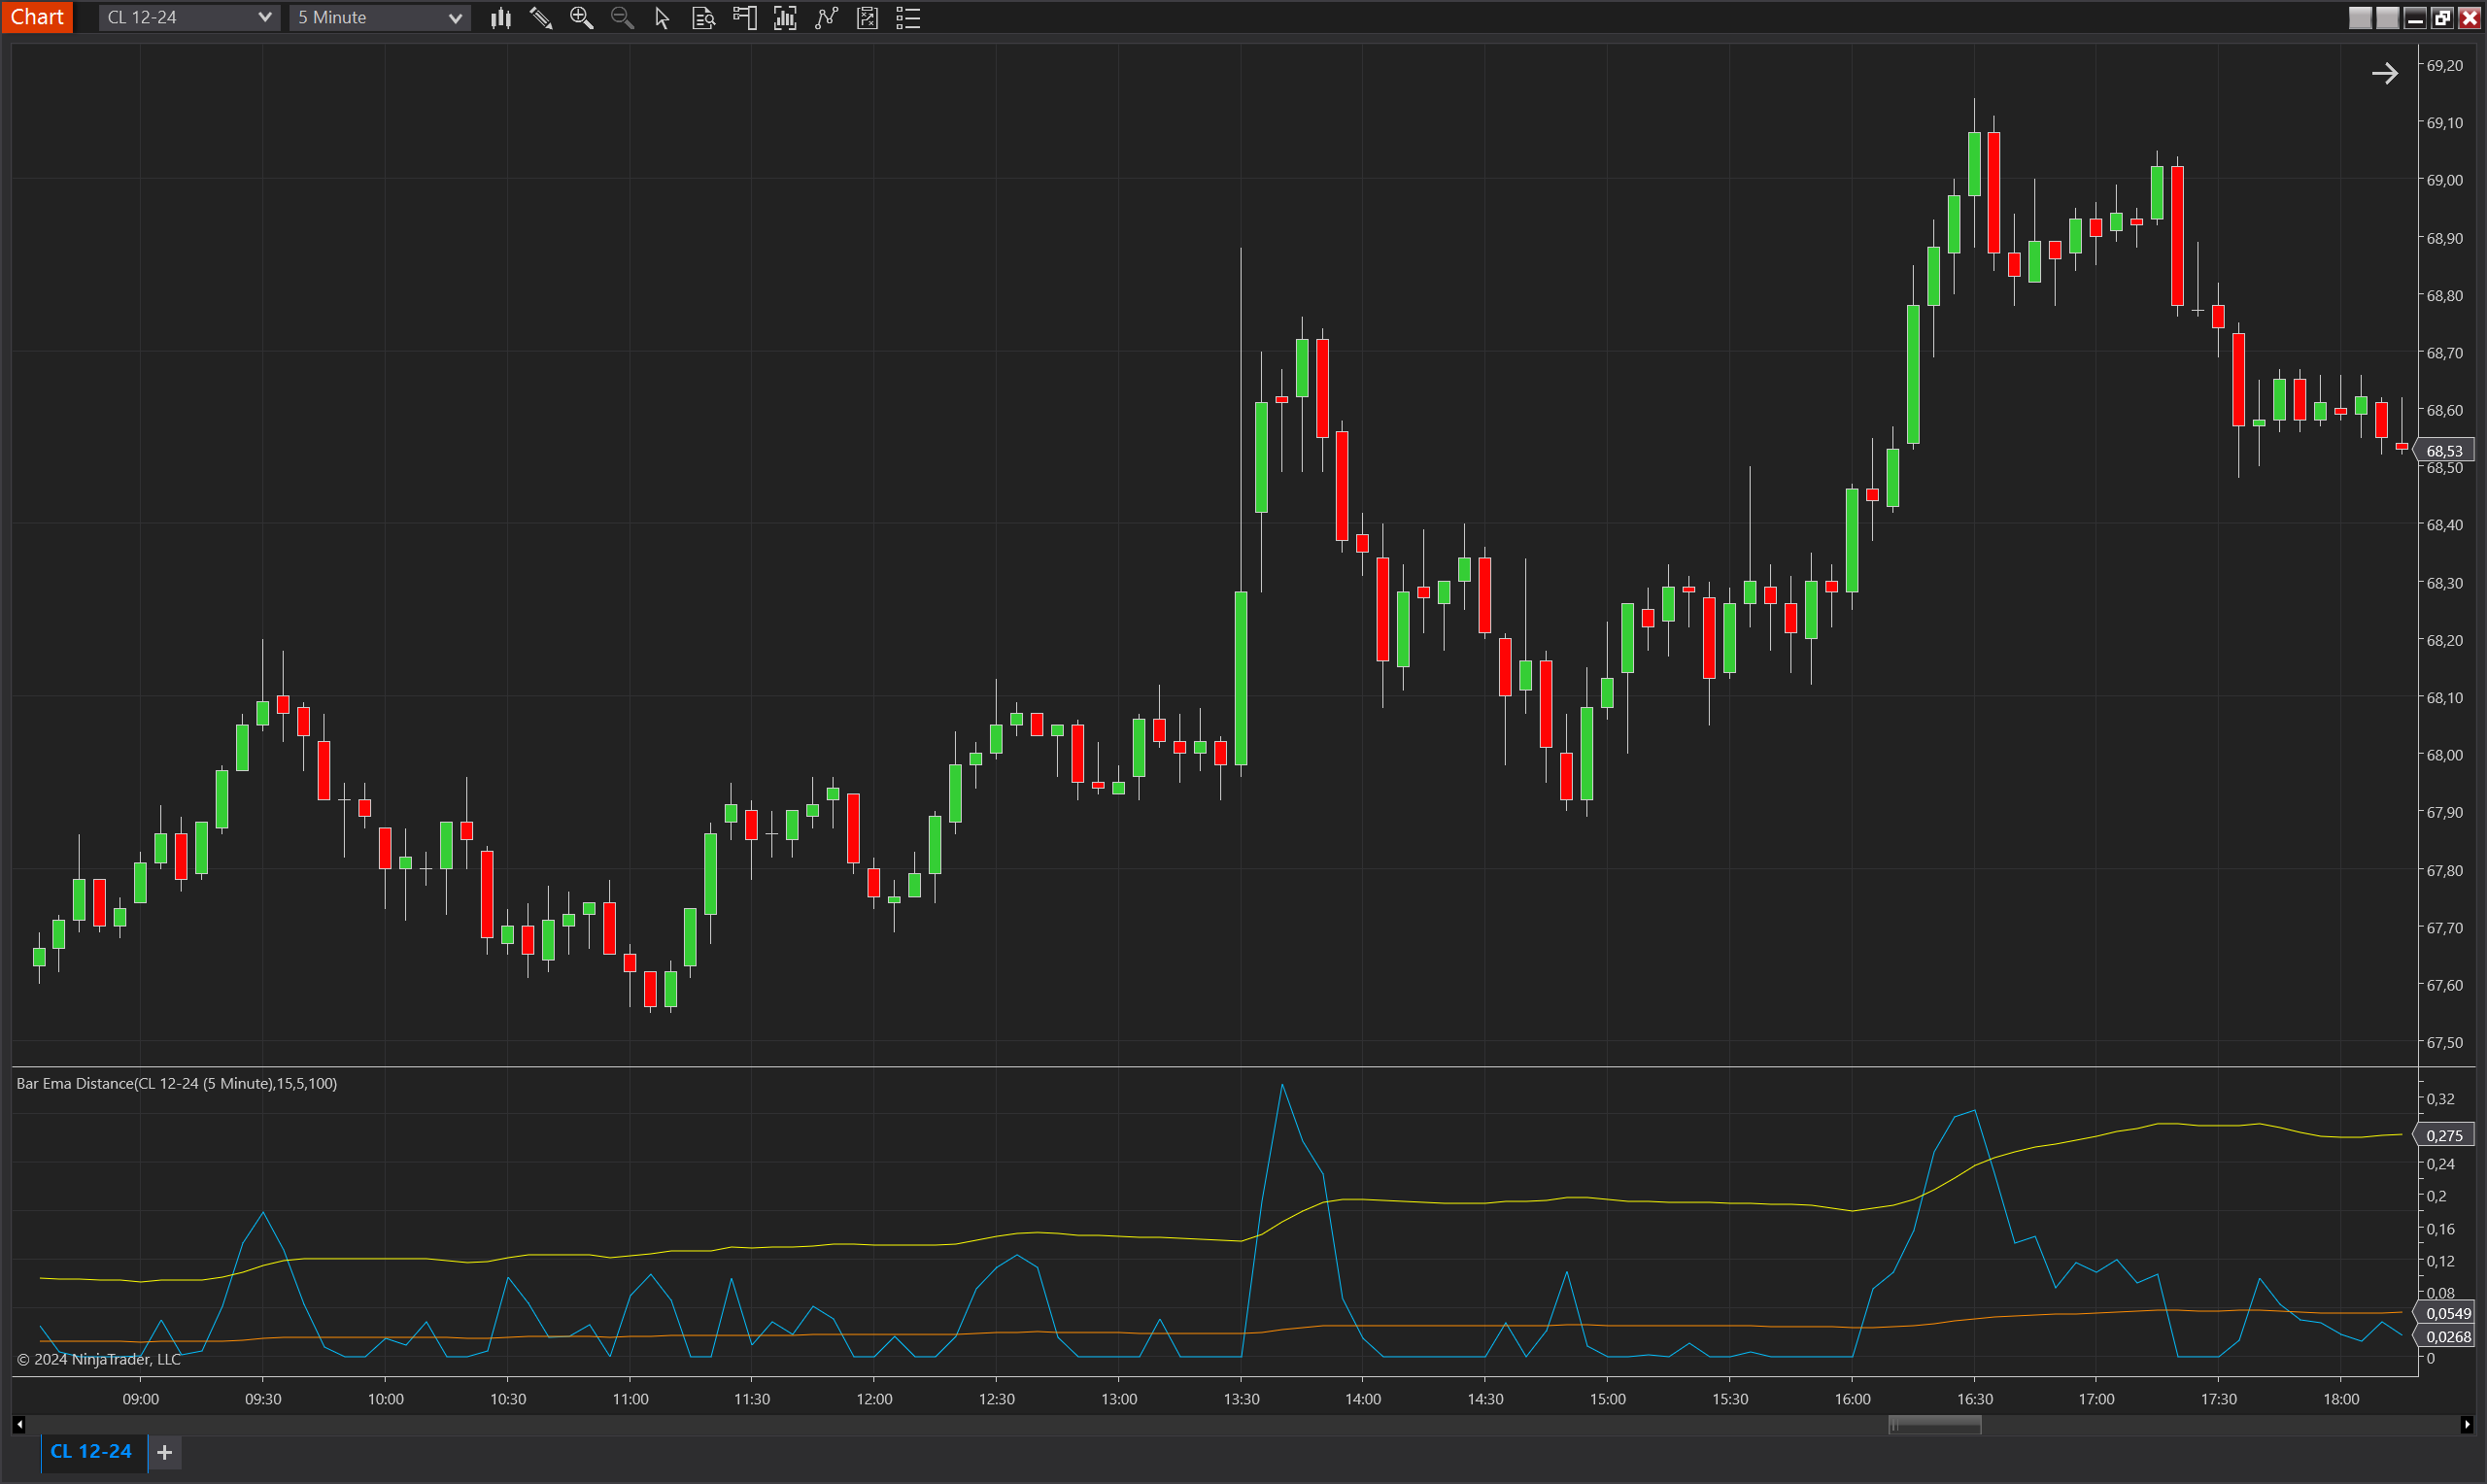
The Bar EMA Distance indicator for NinjaTrader 8 is designed to measure and plot the distance between the current bar's price and an Exponential Moving Average (EMA). It calculates this distance and compares it to the Simple Moving Average (SMA) of these distances and a multiple of this average. This helps traders identify when the market is significantly deviating from the EMA, indicating potential overextension or trend strength. The indicator is useful for evaluating price momentum and possible reversals or trend continuation points.
Key Features
- Distance Measurement: Computes the distance between the bar's high or low and the EMA, indicating whether the bar is above or below the EMA.
- Comparison with SMA: Calculates an SMA of the distance values to smooth out short-term fluctuations and help assess average distance.
- Average Multiplier Plot: Plots an adjustable multiple of the SMA distance to highlight when the current distance is significantly higher than average, suggesting potential price extremities.
- Visual Plots: Provides clear visual plots in different colors for the raw distance, average, and average multiple to simplify analysis.
Tips for Implementation
- Parameter Adjustment: Adjust the EmaPeriod and SmaPeriod based on the market's volatility and the timeframe being analyzed. For shorter-term analysis, use smaller period values.
- Multiplier Setting: The Multiplier parameter allows traders to emphasize specific deviations from the average. Experiment with different values to see what best fits your trading style or the asset's typical behavior.
- Integration: Use in conjunction with trend indicators or oscillators to confirm potential overbought or oversold conditions when the distance exceeds the average multiple.
- Trend Monitoring: Apply this indicator to identify when price action may be overstretched compared to its recent trend, potentially signaling reversals.
Parameters
EmaPeriod:
- Type: int
- Description: The period used for calculating the EMA.
- Default Value: 15
- Valid Values: Any positive integer
SmaPeriod:
- Type: int
- Description: The period for the SMA applied to the distance calculation.
- Default Value: 100
- Valid Values: Any positive integer
Multiplier:
- Type: double
- Description: A factor applied to the SMA of the distances to scale the average plot.
- Default Value: 5
- Valid Values: Any positive double value greater than 1
Plots
Value:
- Type: Plot
- Style: Line
- Color: DeepSkyBlue
- Description: The raw distance between the bar's price and the EMA. Positive if the bar's low is above the EMA, and vice versa.
Average:
- Type: Plot
- Style: Line
- Color: DarkOrange
- Description: The SMA of the distance values, representing a smoothed average of recent distances.
AverageMultiple:
- Type: Plot
- Style: Line
- Color: Yellow
- Description: The SMA value multiplied by the Multiplier, used to indicate significant deviations from the average.