Two TF Liquidity Grab System
Description
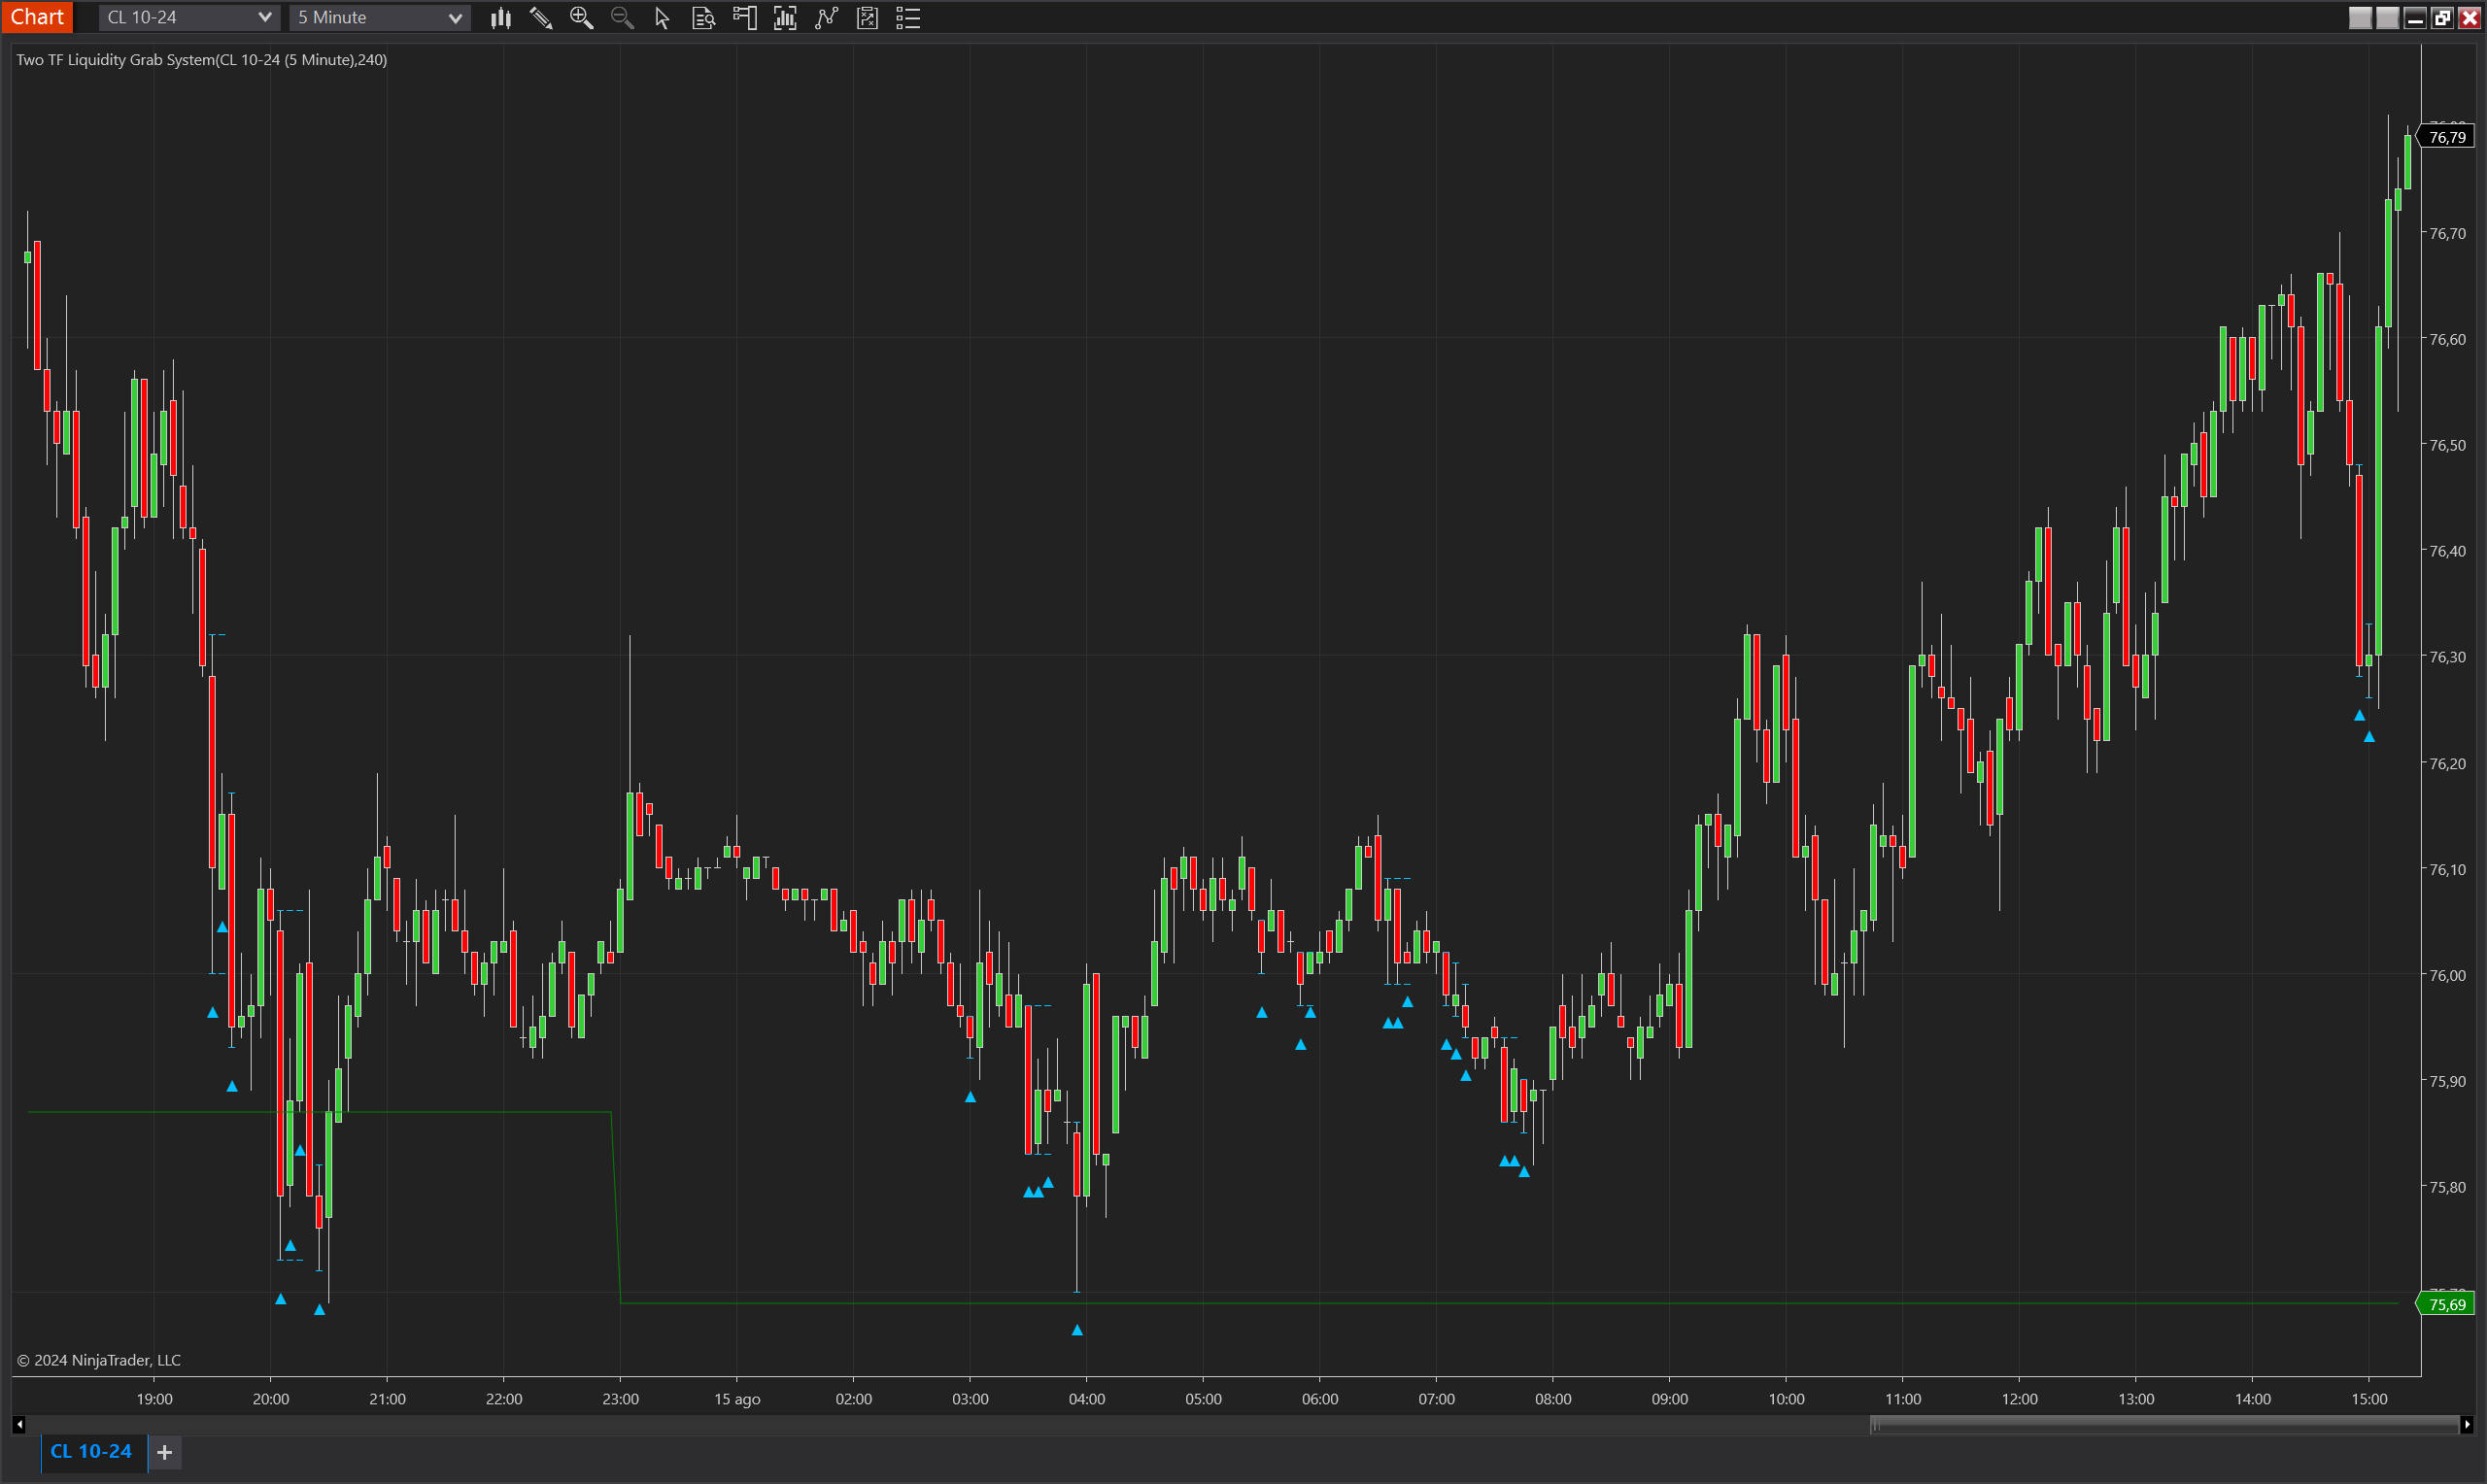
The Two TF Liquidity Grab System is an advanced trading indicator for NinjaTrader 8 that integrates multi-timeframe analysis to identify high-probability liquidity grab opportunities. It utilizes two instances of the Pro Fractal Structure HL indicator—one on the primary timeframe and another on a higher timeframe (often set to a 240-minute chart)—to determine trend and bias. Additionally, the indicator incorporates signals from the Fractal Structure Liquidity Grab indicator to identify potential reversal points where liquidity grabs occur. This combination of multi-timeframe trend analysis and liquidity grab detection offers traders a powerful tool for capturing precise entry points in the market.
This system is particularly effective for swing traders and intraday traders who want to align their trades with broader market trends while taking advantage of short-term liquidity events.
Key Features:
- Multi-Timeframe Analysis: Utilizes a higher timeframe (e.g., 240 minutes) to determine overall market trend and bias, while a lower timeframe provides precise entry signals.
- Fractal Structure Integration: Integrates Pro Fractal Structure HL to identify significant fractal levels and potential liquidity grabs across different timeframes.
- Liquidity Grab Detection: Leverages the Fractal Structure Liquidity Grab indicator to detect short-term liquidity events, indicating potential reversals.
- Visual Signal Plots: Provides clear visual markers on the chart (up and down triangles) for liquidity grab signals, along with plotted levels to indicate upper and lower bounds of the detected liquidity event.
- Dynamic Bias Calculation: The indicator dynamically adjusts its bias based on the interaction between the current price and the mean level of the higher timeframe's fractal structure.
Tips for Implementation:
- Aligning Timeframes: Use a higher timeframe that reflects the broader market trend (e.g., 240-minute or daily) and a lower timeframe (e.g., 15-minute or 30-minute) for identifying entry and exit points. This ensures that trades are made in alignment with the dominant trend.
- Confirming Signals: Combine the liquidity grab signals with other indicators, such as momentum oscillators or volume analysis, to confirm the strength of the signal before entering a trade.
- Parameter Adjustment: Customize the OtherTimeframeMinutes parameter to match the desired higher timeframe, ensuring that the trend and bias are relevant to your trading strategy.
- Backtesting and Optimization: Perform extensive backtesting across different market conditions to fine-tune the settings, such as PlotOffset and OtherTimeframeMinutes, for optimal performance in live trading.
Parameters
Other Timeframe Minutes:
- Type: int
- Description: Defines the higher timeframe in minutes used for trend and bias calculation. Typically set to 240 for 4-hour charts.
- Default Value: 240
- Valid Values: 1 and above
Plot Offset:
- Type: int
- Description: Sets the distance (in ticks) between the plotted signal and the high/low of the bar, allowing for visual adjustment of the signal placement on the chart.
- Default Value: 3
- Valid Values: 0 and above
Trend Up Color:
- Type: Brush
- Description: The color used to indicate an uptrend in the plot lines.
- Default Value: Green
Trend Down Color:
- Type: Brush
- Description: The color used to indicate a downtrend in the plot lines.
- Default Value: Red
No Trend Color:
- Type: Brush
- Description: The color used to indicate a neutral or no trend condition in the plot lines.
- Default Value: Gray
Plots
IndicatorSignalUp:
- Type: Plot
- Style: Triangle Up
- Color: DeepSkyBlue
- Description: Indicates a potential upward liquidity grab signal, typically following a price dip below a key fractal low.
SignalUpUpperLevel:
- Type: Plot
- Style: Hash
- Color: DeepSkyBlue
- Description: Represents the entry level for a trade triggered by an upward liquidity grab. This level is based on whether the price makes a lower low relative to the fractal structure, rather than just the low of the bar.
SignalUpLowerLevel:
- Type: Plot
- Style: Hash
- Color: DeepSkyBlue
- Description: Represents the stop loss level for a trade triggered by an upward liquidity grab. This level is determined by the fractal structure's confirmation of the signal and adjusts dynamically depending on subsequent price action.
IndicatorSignalDown:
- Type: Plot
- Style: Triangle Down
- Color: DeepSkyBlue
- Description: Indicates a potential downward liquidity grab signal, typically following a price spike above a key fractal high.
SignalDownUpperLevel:
- Type: Plot
- Style: Hash
- Color: DeepSkyBlue
- Description: Represents the entry level for a trade triggered by a downward liquidity grab. This level is based on whether the price makes a higher high relative to the fractal structure, rather than just the high of the bar.
SignalDownLowerLevel:
- Type: Plot
- Style: Hash
- Color: DeepSkyBlue
- Description: Represents the stop loss level for a trade triggered by a downward liquidity grab. This level is determined by the fractal structure's confirmation of the signal and adjusts dynamically depending on subsequent price action.
Upper:
- Type: Plot
- Style: Solid Line
- Color: DeepSkyBlue
- Description: Displays the upper fractal level from the higher timeframe, offering a dynamic resistance level and context for the overall trend.
Lower:
- Type: Plot
- Style: Solid Line
- Color: DeepSkyBlue
- Description: Displays the lower fractal level from the higher timeframe, offering a dynamic support level and context for the overall trend.
Mean:
- Type: Plot
- Style: Solid Line
- Color: DeepSkyBlue
- Description: Shows the mean level between the upper and lower fractal levels from the higher timeframe, serving as a central reference for bias determination.